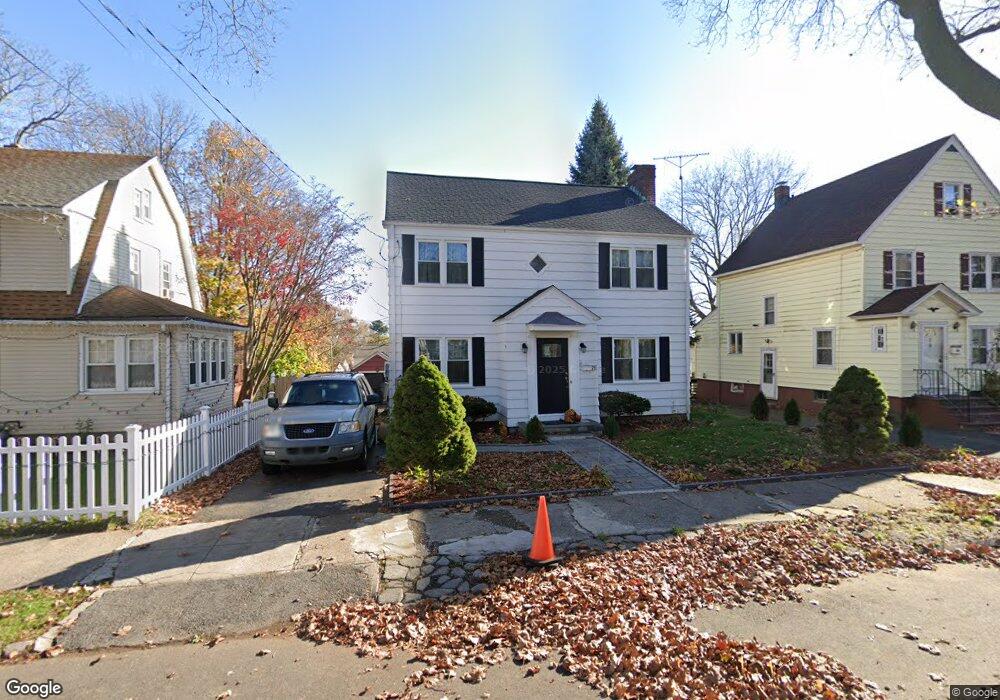
78 Hale Terrace Bridgeport, CT 06610
Boston Ave-Mill Hill NeighborhoodEstimated Value: $376,000 - $448,000
4
Beds
2
Baths
2,158
Sq Ft
$190/Sq Ft
Est. Value
About This Home
This home is located at 78 Hale Terrace, Bridgeport, CT 06610 and is currently estimated at $409,764, approximately $189 per square foot. 78 Hale Terrace is a home located in Fairfield County with nearby schools including Edison School, Harding High School, and Achievement First Bridgeport Academy Elementary School.
Ownership History
Date
Name
Owned For
Owner Type
Purchase Details
Closed on
Sep 9, 2014
Sold by
Lasontant Katie
Bought by
Rosemond Marie
Current Estimated Value
Purchase Details
Closed on
Oct 1, 2008
Sold by
Logan Marcia B
Bought by
Lafontant Yves and Rosemond Marie
Home Financials for this Owner
Home Financials are based on the most recent Mortgage that was taken out on this home.
Original Mortgage
$224,050
Interest Rate
6.54%
Purchase Details
Closed on
Mar 31, 1994
Sold by
New Haven Sb
Bought by
Logoan Maria
Home Financials for this Owner
Home Financials are based on the most recent Mortgage that was taken out on this home.
Original Mortgage
$46,900
Interest Rate
5.25%
Mortgage Type
Unknown
Purchase Details
Closed on
Jan 17, 1989
Sold by
Velky John
Bought by
Rodgrigues John
Create a Home Valuation Report for This Property
The Home Valuation Report is an in-depth analysis detailing your home's value as well as a comparison with similar homes in the area
Home Values in the Area
Average Home Value in this Area
Purchase History
| Date | Buyer | Sale Price | Title Company |
|---|---|---|---|
| Rosemond Marie | -- | -- | |
| Rosemond Marie | -- | -- | |
| Lafontant Yves | $235,850 | -- | |
| Lafontant Yves | $235,850 | -- | |
| Logoan Maria | $71,900 | -- | |
| Logoan Maria | $71,900 | -- | |
| Rodgrigues John | $142,500 | -- |
Source: Public Records
Mortgage History
| Date | Status | Borrower | Loan Amount |
|---|---|---|---|
| Previous Owner | Rodgrigues John | $224,050 | |
| Previous Owner | Rodgrigues John | $46,900 |
Source: Public Records
Tax History Compared to Growth
Tax History
| Year | Tax Paid | Tax Assessment Tax Assessment Total Assessment is a certain percentage of the fair market value that is determined by local assessors to be the total taxable value of land and additions on the property. | Land | Improvement |
|---|---|---|---|---|
| 2025 | $6,914 | $159,130 | $59,730 | $99,400 |
| 2024 | $6,914 | $159,130 | $59,730 | $99,400 |
| 2023 | $6,914 | $159,130 | $59,730 | $99,400 |
| 2022 | $6,914 | $159,130 | $59,730 | $99,400 |
| 2021 | $6,914 | $159,130 | $59,730 | $99,400 |
| 2020 | $6,437 | $119,220 | $23,600 | $95,620 |
| 2019 | $6,437 | $119,220 | $23,600 | $95,620 |
| 2018 | $6,482 | $119,220 | $23,600 | $95,620 |
| 2017 | $6,482 | $119,220 | $23,600 | $95,620 |
| 2016 | $6,482 | $119,220 | $23,600 | $95,620 |
| 2015 | $6,457 | $153,010 | $33,320 | $119,690 |
| 2014 | $6,457 | $153,010 | $33,320 | $119,690 |
Source: Public Records
Map
Nearby Homes
- 357 Granfield Ave Unit B
- 1922 Boston Ave Unit 1924
- 3 Granfield Ave
- 361 Granfield Ave Unit Bldg 8, A
- 401 Granfield Ave Unit 2
- 260 Success Ave Unit 21
- 1575 Boston Ave Unit B2
- 14 Court a
- 400 East Ave
- 69 Weber Ave
- 43 Granfield Ave Unit 45
- 37 Granfield Ave Unit 39
- 295 N Bishop Bld 92 Ave Unit 13
- 33 Granfield Ave
- 290 N Bishop Bishop Ave Unit 12
- 215 Summerfield Ave
- 332 Palisade Ave
- 652 Bishop Ave Unit 656
- 5 Granfield Ave
- 242 Pearl Harbor St
- 70 Hale Terrace
- 90 Hale Terrace
- 60 Hale Terrace
- 100 Hale Terrace
- 89 Carnegie Ave
- 79 Carnegie Ave
- 109 Carnegie Ave
- 77 Carnegie Ave
- 57 Hale Terrace
- 81 Hale Terrace
- 67 Hale Terrace
- 91 Hale Terrace
- 73 Carnegie Ave
- 110 Hale Terrace
- 119 Carnegie Ave
- 103 Hale Terrace
- 47 Hale Terrace
- 40 Hale Terrace
- 120 Hale Terrace
- 59 Carnegie Ave