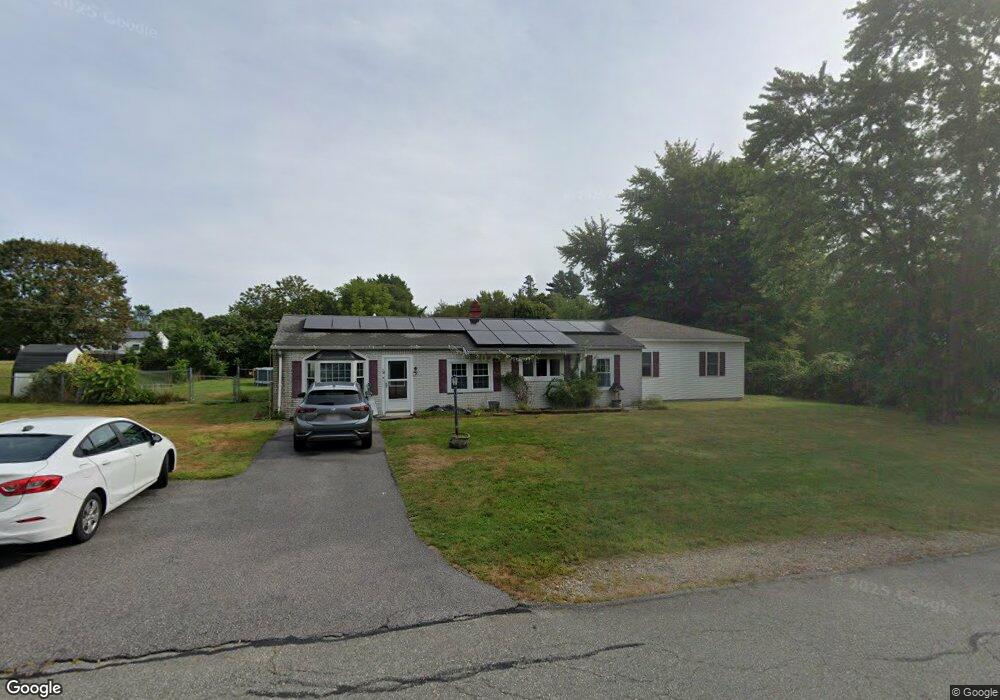
78 Hoover Rd Hanover, MA 02339
Estimated Value: $590,000 - $844,538
6
Beds
3
Baths
2,689
Sq Ft
$289/Sq Ft
Est. Value
About This Home
This home is located at 78 Hoover Rd, Hanover, MA 02339 and is currently estimated at $776,385, approximately $288 per square foot. 78 Hoover Rd is a home located in Plymouth County with nearby schools including Hanover High School and Calvary Chapel Academy.
Ownership History
Date
Name
Owned For
Owner Type
Purchase Details
Closed on
Sep 8, 2020
Sold by
Leach Janet M and Leach Bradford C
Bought by
Lupien Paul R and Lupien Mary E
Current Estimated Value
Home Financials for this Owner
Home Financials are based on the most recent Mortgage that was taken out on this home.
Original Mortgage
$218,000
Outstanding Balance
$192,580
Interest Rate
2.9%
Mortgage Type
New Conventional
Estimated Equity
$583,805
Purchase Details
Closed on
Dec 11, 1975
Bought by
Leach Bradford C and Leach Janet M
Create a Home Valuation Report for This Property
The Home Valuation Report is an in-depth analysis detailing your home's value as well as a comparison with similar homes in the area
Home Values in the Area
Average Home Value in this Area
Purchase History
| Date | Buyer | Sale Price | Title Company |
|---|---|---|---|
| Lupien Paul R | $425,000 | None Available | |
| Lupien Paul R | $425,000 | None Available | |
| Leach Bradford C | -- | -- |
Source: Public Records
Mortgage History
| Date | Status | Borrower | Loan Amount |
|---|---|---|---|
| Open | Lupien Paul R | $218,000 | |
| Closed | Lupien Paul R | $218,000 | |
| Previous Owner | Leach Bradford C | $100,000 | |
| Previous Owner | Leach Bradford C | $50,000 |
Source: Public Records
Tax History Compared to Growth
Tax History
| Year | Tax Paid | Tax Assessment Tax Assessment Total Assessment is a certain percentage of the fair market value that is determined by local assessors to be the total taxable value of land and additions on the property. | Land | Improvement |
|---|---|---|---|---|
| 2025 | $8,550 | $692,300 | $210,300 | $482,000 |
| 2024 | $8,889 | $692,300 | $210,300 | $482,000 |
| 2023 | $5,983 | $443,500 | $191,300 | $252,200 |
| 2022 | $6,320 | $414,400 | $215,200 | $199,200 |
| 2021 | $6,186 | $378,800 | $184,800 | $194,000 |
| 2020 | $5,914 | $362,600 | $173,900 | $188,700 |
| 2019 | $5,251 | $320,000 | $152,200 | $167,800 |
| 2018 | $5,381 | $330,500 | $169,600 | $160,900 |
| 2017 | $4,880 | $295,400 | $158,100 | $137,300 |
| 2016 | $4,980 | $295,400 | $158,100 | $137,300 |
| 2015 | $4,509 | $279,200 | $158,100 | $121,100 |
Source: Public Records
Map
Nearby Homes