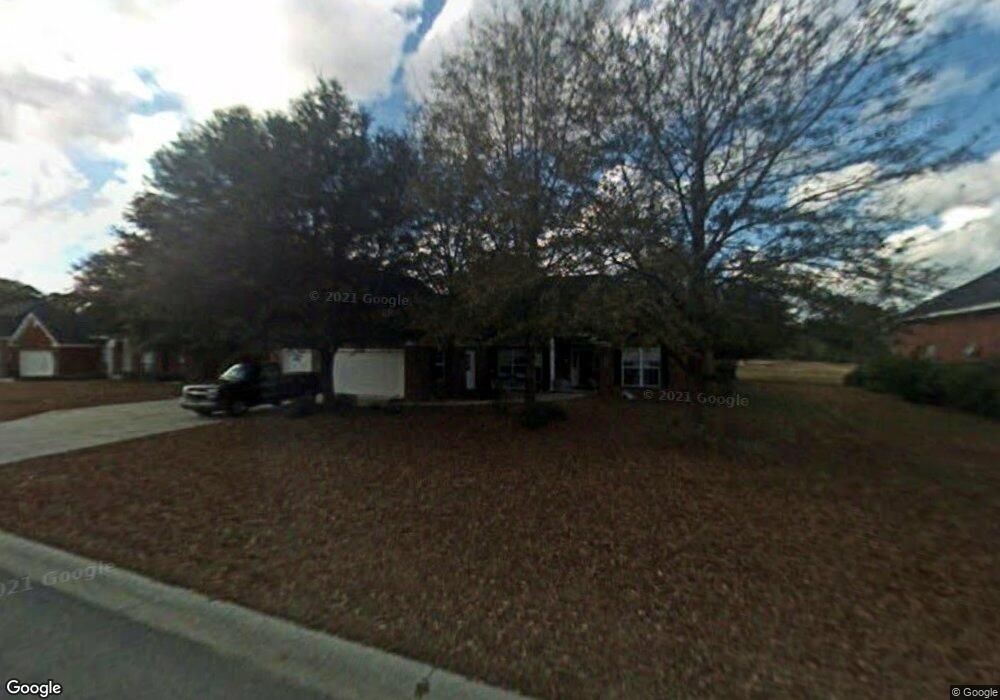
78 Lansing Dr Ellabell, GA 31308
Estimated Value: $418,000 - $499,000
3
Beds
3
Baths
2,417
Sq Ft
$187/Sq Ft
Est. Value
About This Home
This home is located at 78 Lansing Dr, Ellabell, GA 31308 and is currently estimated at $451,770, approximately $186 per square foot. 78 Lansing Dr is a home located in Bryan County with nearby schools including Lanier Primary School, Bryan County Elementary School, and Bryan County Middle School.
Ownership History
Date
Name
Owned For
Owner Type
Purchase Details
Closed on
Mar 21, 2024
Sold by
Sweeney Stephen F
Bought by
Otto Tammy S and Otto Walter Glenn
Current Estimated Value
Home Financials for this Owner
Home Financials are based on the most recent Mortgage that was taken out on this home.
Original Mortgage
$108,000
Outstanding Balance
$101,089
Interest Rate
6.12%
Mortgage Type
New Conventional
Estimated Equity
$350,681
Purchase Details
Closed on
Dec 26, 2002
Sold by
Cendant Mobility Govt Financia
Bought by
Sweeney Stephen F and Sweeney Peggy J
Purchase Details
Closed on
Nov 14, 2002
Sold by
Pagano Salvatore F
Bought by
Cendant Mobility Govt Financial Svs
Purchase Details
Closed on
Oct 25, 2000
Sold by
Dubose Frank W
Bought by
Pagano Salvatore F
Purchase Details
Closed on
Jun 26, 2000
Sold by
Carney Jack E
Bought by
Dubose Frank W
Purchase Details
Closed on
Mar 1, 1997
Create a Home Valuation Report for This Property
The Home Valuation Report is an in-depth analysis detailing your home's value as well as a comparison with similar homes in the area
Home Values in the Area
Average Home Value in this Area
Purchase History
| Date | Buyer | Sale Price | Title Company |
|---|---|---|---|
| Otto Tammy S | $135,000 | -- | |
| Sweeney Stephen F | $240,000 | -- | |
| Cendant Mobility Govt Financial Svs | $114,800 | -- | |
| Pagano Salvatore F | $212,500 | -- | |
| Dubose Frank W | $16,000 | -- | |
| -- | -- | -- | |
| Carney Jack E | $630,000 | -- |
Source: Public Records
Mortgage History
| Date | Status | Borrower | Loan Amount |
|---|---|---|---|
| Open | Otto Tammy S | $108,000 |
Source: Public Records
Tax History Compared to Growth
Tax History
| Year | Tax Paid | Tax Assessment Tax Assessment Total Assessment is a certain percentage of the fair market value that is determined by local assessors to be the total taxable value of land and additions on the property. | Land | Improvement |
|---|---|---|---|---|
| 2024 | $2,926 | $160,440 | $16,880 | $143,560 |
| 2023 | $2,926 | $134,960 | $16,880 | $118,080 |
| 2022 | $1,944 | $114,480 | $16,880 | $97,600 |
| 2021 | $1,590 | $98,440 | $16,880 | $81,560 |
| 2020 | $2,207 | $88,680 | $16,880 | $71,800 |
| 2019 | $1,383 | $89,120 | $16,880 | $72,240 |
| 2018 | $1,325 | $89,120 | $16,880 | $72,240 |
| 2017 | $1,228 | $88,080 | $16,880 | $71,200 |
| 2016 | $1,256 | $88,800 | $16,880 | $71,920 |
| 2015 | $1,353 | $92,640 | $21,960 | $70,680 |
| 2014 | $1,407 | $94,840 | $21,960 | $72,880 |
Source: Public Records
Map
Nearby Homes
- 38 Westhampton Dr
- 58 Westhampton Dr
- 8303 Us Hwy 280
- 32 Sheridan Ct
- 145 Worthington Dr
- 0 Us 80 Hwy Unit 322296
- 589 Old Mill Creek Rd
- 82 Saddlebrush Rd
- 6 Broken Bit Rd
- 100 Hallelujah Trail
- 2391 Homestead Dr
- 50 & 100 Hallelujah Trail
- 17 Sagefield Dr
- 0 Ga 204 Hwy Unit 328802
- 0 Pine Needle Dr Unit 281939
- 628 Toni Branch Rd
- 0 Wilma Edwards Rd Unit 10510556
- 8 Palmetto Dr
- 25 Frank Edwards Rd
- 1000 Pine Needle Dr
- 58 Lansing Dr
- 98 Lansing Dr Unit 5
- 98 Lansing Dr
- 0 Lansing Dr Unit 8002910
- 0 Lansing Dr Unit 8391907
- 0 Lansing Dr
- 38 Lansing Dr
- 118 Lansing Dr
- 67 Lansing Dr
- 67 Lansing Dr
- 47 Lansing Dr
- 107 Lansing Dr
- 138 Lansing Dr
- 18 Lansing Dr
- 31 Lansing Dr
- 127 Lansing Dr
- 11 Lansing Dr
- 145 Lansing Dr
- 148 Lansing Dr
- 154 Lansing Dr