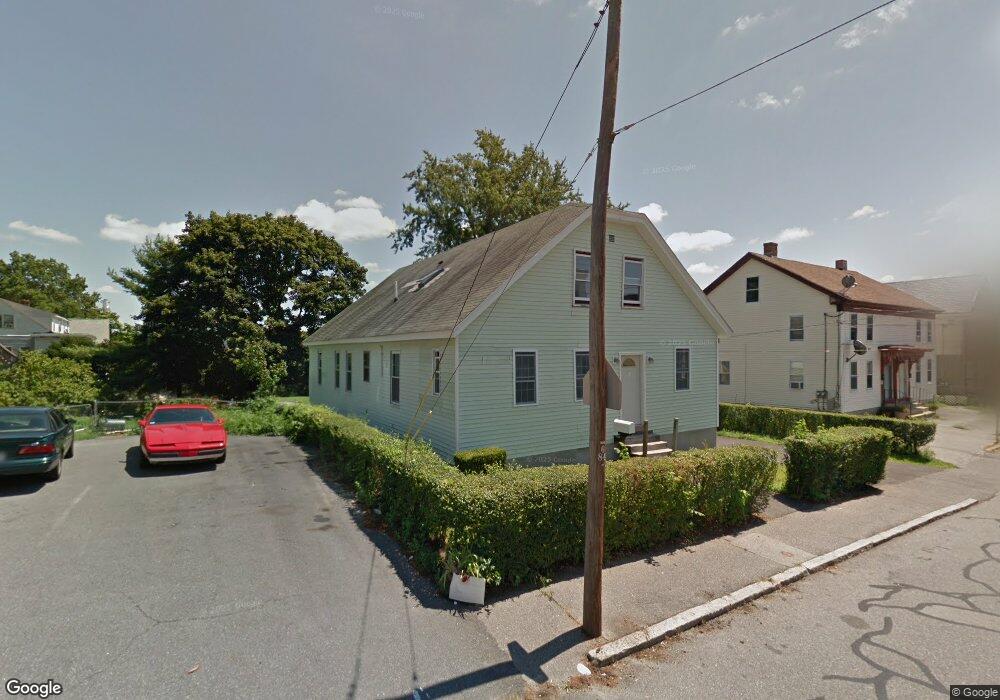
78 Lincoln St Lowell, MA 01851
Lower Highlands NeighborhoodEstimated Value: $506,000 - $561,502
3
Beds
1
Bath
2,387
Sq Ft
$228/Sq Ft
Est. Value
About This Home
This home is located at 78 Lincoln St, Lowell, MA 01851 and is currently estimated at $543,876, approximately $227 per square foot. 78 Lincoln St is a home located in Middlesex County with nearby schools including Abraham Lincoln Elementary School, Charles W. Morey Elementary School, and Dr. Gertrude Bailey Elementary School.
Ownership History
Date
Name
Owned For
Owner Type
Purchase Details
Closed on
Jun 29, 2017
Sold by
Noun Henry and Moeun Amanda
Bought by
Touch Chansovannika and Kheng Chandaro
Current Estimated Value
Home Financials for this Owner
Home Financials are based on the most recent Mortgage that was taken out on this home.
Original Mortgage
$287,693
Outstanding Balance
$237,510
Interest Rate
3.75%
Mortgage Type
FHA
Estimated Equity
$306,366
Purchase Details
Closed on
Sep 23, 2009
Sold by
Noun Henry
Bought by
Noun Henry and Moeun Amanda
Purchase Details
Closed on
Mar 23, 2009
Sold by
Wilmington Trust Co
Bought by
Noun Henry
Purchase Details
Closed on
Nov 26, 2008
Sold by
Mehigan Paul and Collins Mark
Bought by
Wilmington Trust Co
Purchase Details
Closed on
Dec 30, 2003
Sold by
Collins Clara K Est and Collins
Bought by
Collins Mark R
Home Financials for this Owner
Home Financials are based on the most recent Mortgage that was taken out on this home.
Original Mortgage
$120,000
Interest Rate
6.01%
Mortgage Type
Purchase Money Mortgage
Create a Home Valuation Report for This Property
The Home Valuation Report is an in-depth analysis detailing your home's value as well as a comparison with similar homes in the area
Home Values in the Area
Average Home Value in this Area
Purchase History
| Date | Buyer | Sale Price | Title Company |
|---|---|---|---|
| Touch Chansovannika | $293,000 | -- | |
| Noun Henry | -- | -- | |
| Noun Henry | -- | -- | |
| Noun Henry | $92,000 | -- | |
| Noun Henry | $92,000 | -- | |
| Wilmington Trust Co | $127,500 | -- | |
| Wilmington Trust Co | $127,500 | -- | |
| Collins Mark R | -- | -- | |
| Collins Mark R | -- | -- | |
| Collins Mark R | -- | -- |
Source: Public Records
Mortgage History
| Date | Status | Borrower | Loan Amount |
|---|---|---|---|
| Open | Touch Chansovannika | $287,693 | |
| Closed | Collins Mark R | $287,693 | |
| Previous Owner | Collins Mark R | $120,000 |
Source: Public Records
Tax History Compared to Growth
Tax History
| Year | Tax Paid | Tax Assessment Tax Assessment Total Assessment is a certain percentage of the fair market value that is determined by local assessors to be the total taxable value of land and additions on the property. | Land | Improvement |
|---|---|---|---|---|
| 2025 | $5,437 | $473,600 | $140,300 | $333,300 |
| 2024 | $5,111 | $429,100 | $131,100 | $298,000 |
| 2023 | $4,727 | $380,600 | $114,000 | $266,600 |
| 2022 | $4,490 | $353,800 | $90,100 | $263,700 |
| 2021 | $4,397 | $326,700 | $78,400 | $248,300 |
| 2020 | $4,179 | $312,800 | $78,400 | $234,400 |
| 2019 | $4,237 | $301,800 | $74,600 | $227,200 |
| 2018 | $3,848 | $267,400 | $71,000 | $196,400 |
| 2017 | $3,649 | $244,600 | $68,900 | $175,700 |
| 2016 | $3,369 | $222,200 | $64,000 | $158,200 |
| 2015 | $3,071 | $198,400 | $64,000 | $134,400 |
| 2013 | $2,010 | $133,900 | $76,700 | $57,200 |
Source: Public Records
Map
Nearby Homes
- 60 Liberty St Unit 3
- 15 Barclay St
- 31 Waite St
- 100 Lane St
- 710 School St
- 46 Bellevue St
- 53 Royal St
- 131 London St
- 27 Bellevue St
- 85 B St
- 255 Plain St
- 173 Westford St
- 201 Thorndike St Unit 501
- 201 Thorndike St Unit 1-23
- 195 Thorndike St Unit 4
- 21 Kimball Ave
- 69 Blossom St
- 762 Gorham St Unit 3
- 45 Marshall St
- 42 Branch St
- 84 Lincoln St
- 74 Lincoln St
- 73 Washington St
- 88 Lincoln St
- 67 Washington St
- 83 Washington St
- 75 Lincoln St
- 58 Short St
- 58 Short St Unit 3
- 58 Short St Unit 2
- 60 Lincoln St
- 89 Washington St
- 79 Lincoln St
- 85 Lincoln St
- 59 Washington St Unit 7
- 59 Washington St Unit 5
- 59 Washington St Unit 8
- 59 Washington St Unit 6
- 54 Lincoln St
- 54 Lincoln St Unit 1