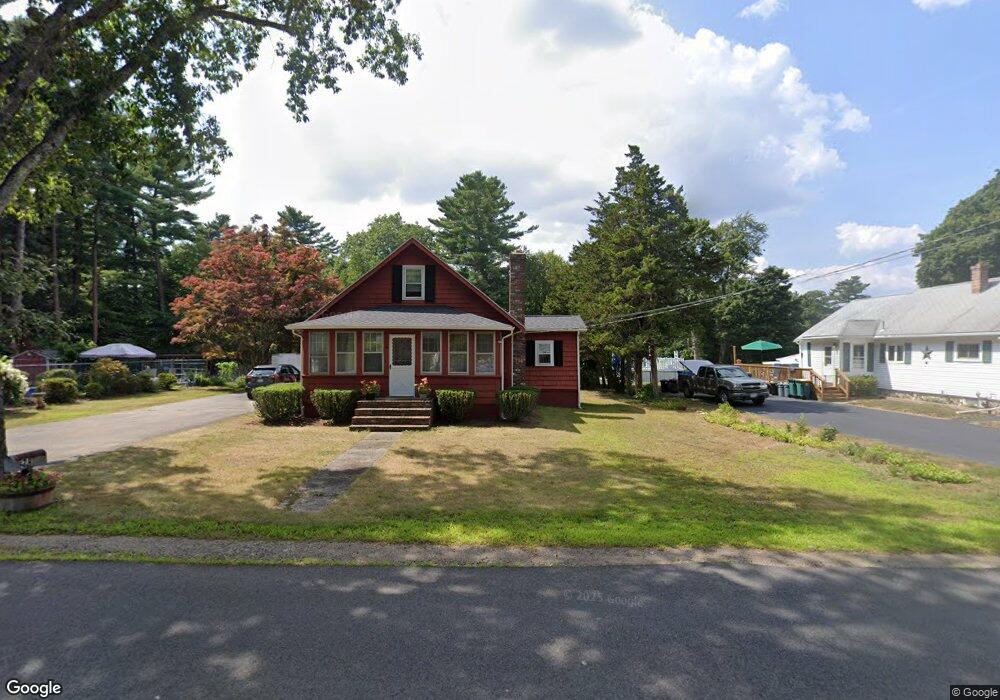
78 Linwood St Abington, MA 02351
Estimated Value: $520,000 - $530,942
3
Beds
1
Bath
1,360
Sq Ft
$387/Sq Ft
Est. Value
About This Home
This home is located at 78 Linwood St, Abington, MA 02351 and is currently estimated at $525,986, approximately $386 per square foot. 78 Linwood St is a home located in Plymouth County with nearby schools including Beaver Brook Elementary School, Abington Middle School, and Woodsdale School.
Ownership History
Date
Name
Owned For
Owner Type
Purchase Details
Closed on
Dec 10, 2024
Sold by
Brennan Janice
Bought by
Jance Brennan Irt and Brennan
Current Estimated Value
Purchase Details
Closed on
Apr 18, 1989
Sold by
Collins Frank A
Bought by
Strignano Henry J
Home Financials for this Owner
Home Financials are based on the most recent Mortgage that was taken out on this home.
Original Mortgage
$63,750
Interest Rate
10.85%
Mortgage Type
Purchase Money Mortgage
Purchase Details
Closed on
Nov 16, 1988
Sold by
F L Gilmetti & Sons
Bought by
Mannering Elaine
Home Financials for this Owner
Home Financials are based on the most recent Mortgage that was taken out on this home.
Original Mortgage
$76,789
Interest Rate
10.28%
Mortgage Type
Purchase Money Mortgage
Create a Home Valuation Report for This Property
The Home Valuation Report is an in-depth analysis detailing your home's value as well as a comparison with similar homes in the area
Home Values in the Area
Average Home Value in this Area
Purchase History
| Date | Buyer | Sale Price | Title Company |
|---|---|---|---|
| Jance Brennan Irt | -- | None Available | |
| Jance Brennan Irt | -- | None Available | |
| Strignano Henry J | $127,500 | -- | |
| Mannering Elaine | $184,000 | -- |
Source: Public Records
Mortgage History
| Date | Status | Borrower | Loan Amount |
|---|---|---|---|
| Previous Owner | Mannering Elaine | $63,750 | |
| Previous Owner | Mannering Elaine | $76,789 | |
| Previous Owner | Mannering Elaine | $73,197 |
Source: Public Records
Tax History Compared to Growth
Tax History
| Year | Tax Paid | Tax Assessment Tax Assessment Total Assessment is a certain percentage of the fair market value that is determined by local assessors to be the total taxable value of land and additions on the property. | Land | Improvement |
|---|---|---|---|---|
| 2025 | $5,959 | $456,300 | $258,500 | $197,800 |
| 2024 | $6,140 | $458,900 | $236,800 | $222,100 |
| 2023 | $5,859 | $412,300 | $208,400 | $203,900 |
| 2022 | $5,916 | $388,700 | $184,800 | $203,900 |
| 2021 | $5,564 | $337,600 | $169,400 | $168,200 |
| 2020 | $5,642 | $331,900 | $164,800 | $167,100 |
| 2019 | $5,266 | $302,800 | $157,900 | $144,900 |
| 2018 | $22,132 | $286,200 | $157,900 | $128,300 |
| 2017 | $5,057 | $275,600 | $157,900 | $117,700 |
| 2016 | $4,615 | $257,400 | $151,300 | $106,100 |
| 2015 | $4,485 | $263,800 | $151,300 | $112,500 |
Source: Public Records
Map
Nearby Homes