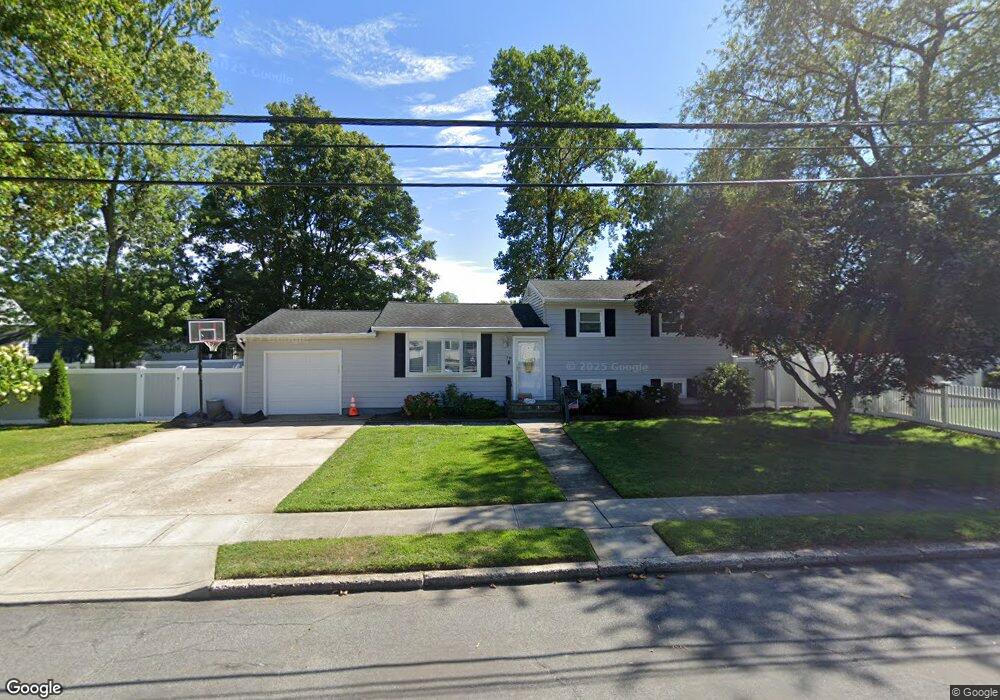
78 Maple Dr Lindenhurst, NY 11757
Estimated Value: $608,000 - $721,000
3
Beds
2
Baths
1,032
Sq Ft
$641/Sq Ft
Est. Value
About This Home
This home is located at 78 Maple Dr, Lindenhurst, NY 11757 and is currently estimated at $661,975, approximately $641 per square foot. 78 Maple Dr is a home located in Suffolk County with nearby schools including William Rall School, Lindenhurst Middle School, and Lindenhurst Senior High School.
Ownership History
Date
Name
Owned For
Owner Type
Purchase Details
Closed on
Aug 31, 2021
Sold by
Diaz Jean C and Diaz Delis C
Bought by
Nally James
Current Estimated Value
Purchase Details
Closed on
May 12, 2017
Sold by
Copiague 1 Llc
Bought by
Diaz Jean C and Diaz Delis C
Home Financials for this Owner
Home Financials are based on the most recent Mortgage that was taken out on this home.
Original Mortgage
$310,490
Interest Rate
4.37%
Mortgage Type
FHA
Purchase Details
Closed on
Dec 16, 2016
Sold by
Hashem Iman and Habash Jaber
Bought by
Copiague 1 Llc
Purchase Details
Closed on
Sep 2, 1998
Sold by
Hoffman George P and Hoffman Patricia M
Bought by
Hashem Iman
Home Financials for this Owner
Home Financials are based on the most recent Mortgage that was taken out on this home.
Original Mortgage
$132,000
Interest Rate
6.92%
Create a Home Valuation Report for This Property
The Home Valuation Report is an in-depth analysis detailing your home's value as well as a comparison with similar homes in the area
Home Values in the Area
Average Home Value in this Area
Purchase History
| Date | Buyer | Sale Price | Title Company |
|---|---|---|---|
| Nally James | -- | None Available | |
| Diaz Jean C | $359,000 | Standish Title Agency | |
| Copiague 1 Llc | $145,000 | Priority One Title Agency In | |
| Hashem Iman | -- | -- |
Source: Public Records
Mortgage History
| Date | Status | Borrower | Loan Amount |
|---|---|---|---|
| Previous Owner | Diaz Jean C | $310,490 | |
| Previous Owner | Hashem Iman | $132,000 |
Source: Public Records
Tax History
| Year | Tax Paid | Tax Assessment Tax Assessment Total Assessment is a certain percentage of the fair market value that is determined by local assessors to be the total taxable value of land and additions on the property. | Land | Improvement |
|---|---|---|---|---|
| 2024 | $11,781 | $3,070 | $570 | $2,500 |
| 2023 | $11,781 | $3,070 | $570 | $2,500 |
| 2022 | $11,260 | $3,070 | $570 | $2,500 |
| 2021 | $11,260 | $3,070 | $570 | $2,500 |
| 2020 | $10,954 | $3,070 | $570 | $2,500 |
| 2019 | $10,954 | $0 | $0 | $0 |
| 2018 | $10,616 | $3,070 | $570 | $2,500 |
| 2017 | $10,616 | $3,070 | $570 | $2,500 |
| 2016 | $13,455 | $3,070 | $570 | $2,500 |
| 2015 | -- | $3,070 | $570 | $2,500 |
| 2014 | -- | $3,070 | $570 | $2,500 |
Source: Public Records
Map
Nearby Homes
Your Personal Tour Guide
Ask me questions while you tour the home.