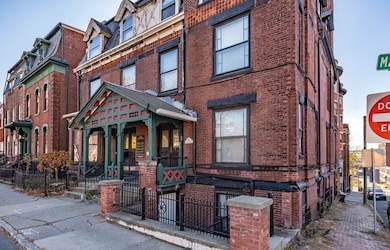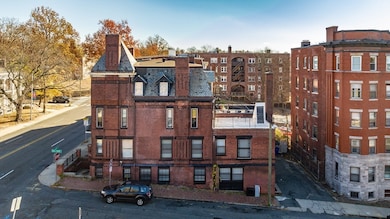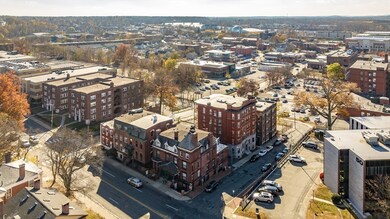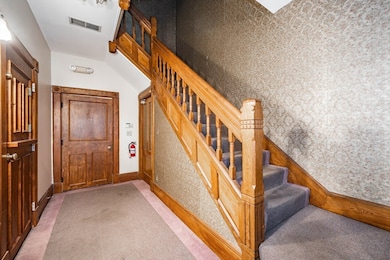
78 Maple St Springfield, MA 01105
Metro Center NeighborhoodHighlights
- Medical Services
- Open Floorplan
- Wood Flooring
- City View
- Property is near public transit
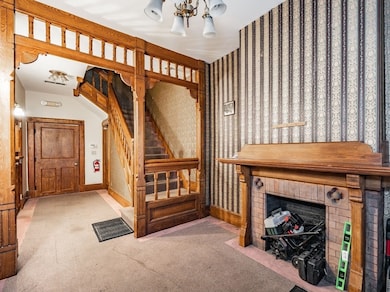
- 2 Fireplaces
About This Home
As of June 2025Attention Investors & FHA/VA Buyers Take Notice of this Amazing Investment Opportunity In Springfield! 4 Family Brick Building a Short walk to MGM Casino in Thriving Downtown Springfield, MA Home of the Basketball Hall of Fame. Also located close to highways, entertainment, restaurants & hotels This is an Amazing Opportunity to add to or begin your investment portfolio! 3 Bedroom unit will be delivered Vacant! Current rents are under market allowing you for upside opportunities! Recent price drop due to seller having other business interests. You can now get this 4 unit for the price of 2 units in Springfield! Don't Miss Out On This Deal!
Property Details
Home Type
- Multi-Family
Est. Annual Taxes
- $5,661
Year Built
- Built in 1897
Lot Details
- 2,187 Sq Ft Lot
- Corner Lot
Home Design
- Quadruplex
- Brick Exterior Construction
- Brick Foundation
- Rubber Roof
Interior Spaces
- 5,408 Sq Ft Home
- Property has 1 Level
- Open Floorplan
- 2 Fireplaces
- Living Room
- City Views
- Basement Fills Entire Space Under The House
Flooring
- Wood
- Carpet
- Laminate
- Tile
- Vinyl
Bedrooms and Bathrooms
- 8 Bedrooms
Parking
- 1 Car Parking Space
- Driveway
- Open Parking
Outdoor Features
- Rain Gutters
Location
- Property is near public transit
- Property is near schools
Utilities
- Forced Air Heating System
- Heating System Uses Natural Gas
Listing and Financial Details
- Total Actual Rent $4,575
- Assessor Parcel Number S:08218 P:0024,2594010
Community Details
Amenities
- Medical Services
- Shops
- Coin Laundry
Recreation
- Park
Additional Features
- 4 Units
- Net Operating Income $54,900
Ownership History
Purchase Details
Home Financials for this Owner
Home Financials are based on the most recent Mortgage that was taken out on this home.Purchase Details
Purchase Details
Similar Homes in Springfield, MA
Home Values in the Area
Average Home Value in this Area
Purchase History
| Date | Type | Sale Price | Title Company |
|---|---|---|---|
| Deed | $474,109 | None Available | |
| Quit Claim Deed | -- | -- | |
| Quit Claim Deed | -- | -- | |
| Quit Claim Deed | -- | -- | |
| Deed | $36,000 | -- | |
| Deed | $36,000 | -- |
Mortgage History
| Date | Status | Loan Amount | Loan Type |
|---|---|---|---|
| Open | $70,000 | Second Mortgage Made To Cover Down Payment | |
| Closed | $70,000 | Second Mortgage Made To Cover Down Payment | |
| Previous Owner | $450,000 | Purchase Money Mortgage | |
| Previous Owner | $230,800 | Purchase Money Mortgage | |
| Previous Owner | $100,000 | Commercial |
Property History
| Date | Event | Price | Change | Sq Ft Price |
|---|---|---|---|---|
| 06/20/2025 06/20/25 | Sold | $441,000 | -8.1% | $82 / Sq Ft |
| 04/15/2025 04/15/25 | Pending | -- | -- | -- |
| 04/14/2025 04/14/25 | Price Changed | $479,900 | -3.0% | $89 / Sq Ft |
| 04/09/2025 04/09/25 | Price Changed | $494,900 | -1.0% | $92 / Sq Ft |
| 03/10/2025 03/10/25 | Price Changed | $499,900 | -1.4% | $92 / Sq Ft |
| 03/04/2025 03/04/25 | Price Changed | $507,000 | -1.6% | $94 / Sq Ft |
| 02/21/2025 02/21/25 | Price Changed | $515,000 | -0.9% | $95 / Sq Ft |
| 02/03/2025 02/03/25 | Price Changed | $519,900 | -1.0% | $96 / Sq Ft |
| 11/18/2024 11/18/24 | For Sale | $525,000 | +16.7% | $97 / Sq Ft |
| 05/30/2023 05/30/23 | Sold | $450,000 | 0.0% | $83 / Sq Ft |
| 04/17/2023 04/17/23 | Pending | -- | -- | -- |
| 04/11/2023 04/11/23 | For Sale | $450,000 | +56.0% | $83 / Sq Ft |
| 01/25/2022 01/25/22 | Sold | $288,500 | 0.0% | $53 / Sq Ft |
| 11/09/2021 11/09/21 | Pending | -- | -- | -- |
| 11/09/2021 11/09/21 | For Sale | -- | -- | -- |
| 10/22/2021 10/22/21 | Off Market | $288,500 | -- | -- |
| 10/21/2021 10/21/21 | Pending | -- | -- | -- |
| 03/27/2021 03/27/21 | For Sale | $299,000 | -- | $55 / Sq Ft |
Tax History Compared to Growth
Tax History
| Year | Tax Paid | Tax Assessment Tax Assessment Total Assessment is a certain percentage of the fair market value that is determined by local assessors to be the total taxable value of land and additions on the property. | Land | Improvement |
|---|---|---|---|---|
| 2025 | $5,598 | $357,000 | $22,200 | $334,800 |
| 2024 | $5,661 | $352,500 | $20,800 | $331,700 |
| 2023 | $4,135 | $242,500 | $35,000 | $207,500 |
| 2022 | $4,396 | $233,600 | $11,200 | $222,400 |
| 2021 | $5,447 | $204,300 | $48,200 | $156,100 |
| 2020 | $5,447 | $198,100 | $48,200 | $149,900 |
| 2019 | $2,795 | $197,600 | $47,700 | $149,900 |
| 2018 | $0 | $201,900 | $47,700 | $154,200 |
| 2017 | $0 | $201,300 | $39,000 | $162,300 |
| 2016 | -- | $191,600 | $39,000 | $152,600 |
| 2015 | -- | $182,600 | $39,000 | $143,600 |
Agents Affiliated with this Home
-
Jim Charles
J
Seller's Agent in 2025
Jim Charles
Lock and Key Realty Inc.
(413) 320-9979
4 in this area
40 Total Sales
-
Chester Ardolino

Seller's Agent in 2023
Chester Ardolino
Berkshire Hathaway HomeServices Realty Professionals
(413) 221-0310
8 in this area
142 Total Sales
-
Paul Bongiorni

Seller's Agent in 2022
Paul Bongiorni
Pioneer CRE
(413) 459-0570
2 in this area
35 Total Sales
Map
Source: MLS Property Information Network (MLS PIN)
MLS Number: 73313759
APN: SPRI-008218-000000-000024
- 265 Union St
- 235 State St Unit 220
- 235 State St Unit 409
- 66 Morris St Unit 703
- 64 Morris St Unit 702
- 62 Morris St Unit 701
- 58 Morris St Unit 604
- 56 Morris St Unit 603
- 54 Morris St Unit 602
- 52 Morris St Unit 601
- 57 Morris St Unit 204
- 45 Morris St Unit 106
- 91 Mulberry St
- 39 Morris St Unit 103
- 37 Morris St Unit 102
- 56 Central St Unit 504
- 54 Central St Unit 506
- 101 Mulberry St Unit 219
- 101 Mulberry St Unit 506
- 52 Central St Unit 504

