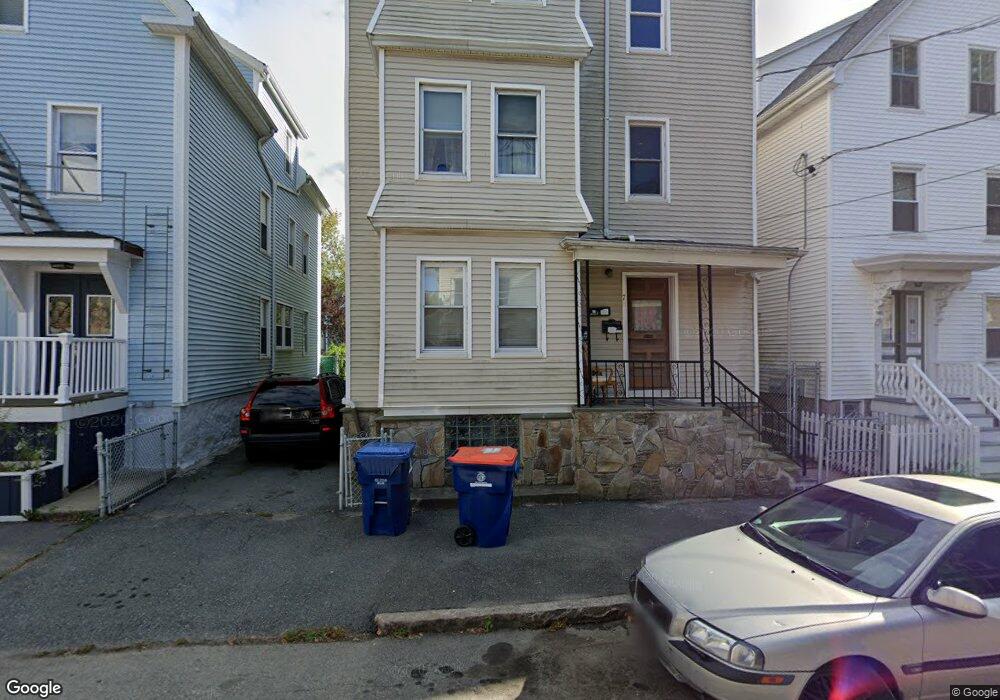
78 Mosher St New Bedford, MA 02744
The South End NeighborhoodEstimated Value: $325,155 - $624,000
9
Beds
4
Baths
3,330
Sq Ft
$163/Sq Ft
Est. Value
About This Home
This home is located at 78 Mosher St, New Bedford, MA 02744 and is currently estimated at $544,289, approximately $163 per square foot. 78 Mosher St is a home located in Bristol County with nearby schools including John B. DeValles Elementary School, Roosevelt Middle School, and New Bedford High School.
Ownership History
Date
Name
Owned For
Owner Type
Purchase Details
Closed on
May 9, 2016
Sold by
Vieira Ft
Bought by
78 Mosher Street Rt
Current Estimated Value
Purchase Details
Closed on
Dec 16, 2013
Sold by
Vieira Manuel and Vieira Cecelia
Bought by
Vieira Irt and Couto
Purchase Details
Closed on
Jan 5, 2007
Sold by
Sousa Connie
Bought by
Vieira Cecelia and Vieira Manuel
Create a Home Valuation Report for This Property
The Home Valuation Report is an in-depth analysis detailing your home's value as well as a comparison with similar homes in the area
Home Values in the Area
Average Home Value in this Area
Purchase History
| Date | Buyer | Sale Price | Title Company |
|---|---|---|---|
| 78 Mosher Street Rt | $165,000 | -- | |
| 78 Mosher Street Rt | $165,000 | -- | |
| Vieira Irt | -- | -- | |
| Vieira Irt | -- | -- | |
| Vieira Cecelia | -- | -- | |
| Vieira Cecelia | -- | -- |
Source: Public Records
Tax History Compared to Growth
Tax History
| Year | Tax Paid | Tax Assessment Tax Assessment Total Assessment is a certain percentage of the fair market value that is determined by local assessors to be the total taxable value of land and additions on the property. | Land | Improvement |
|---|---|---|---|---|
| 2025 | $5,204 | $460,100 | $78,900 | $381,200 |
| 2024 | $4,602 | $383,500 | $74,000 | $309,500 |
| 2023 | $4,160 | $291,100 | $63,100 | $228,000 |
| 2022 | $3,726 | $239,800 | $57,500 | $182,300 |
| 2021 | $3,640 | $233,500 | $57,500 | $176,000 |
| 2020 | $3,562 | $220,400 | $54,200 | $166,200 |
| 2019 | $3,080 | $187,000 | $54,200 | $132,800 |
| 2018 | $2,932 | $176,300 | $54,200 | $122,100 |
| 2017 | $2,715 | $162,700 | $54,200 | $108,500 |
| 2016 | $2,637 | $159,900 | $55,900 | $104,000 |
| 2015 | $2,503 | $159,100 | $57,500 | $101,600 |
| 2014 | $2,412 | $159,100 | $57,500 | $101,600 |
Source: Public Records
Map
Nearby Homes