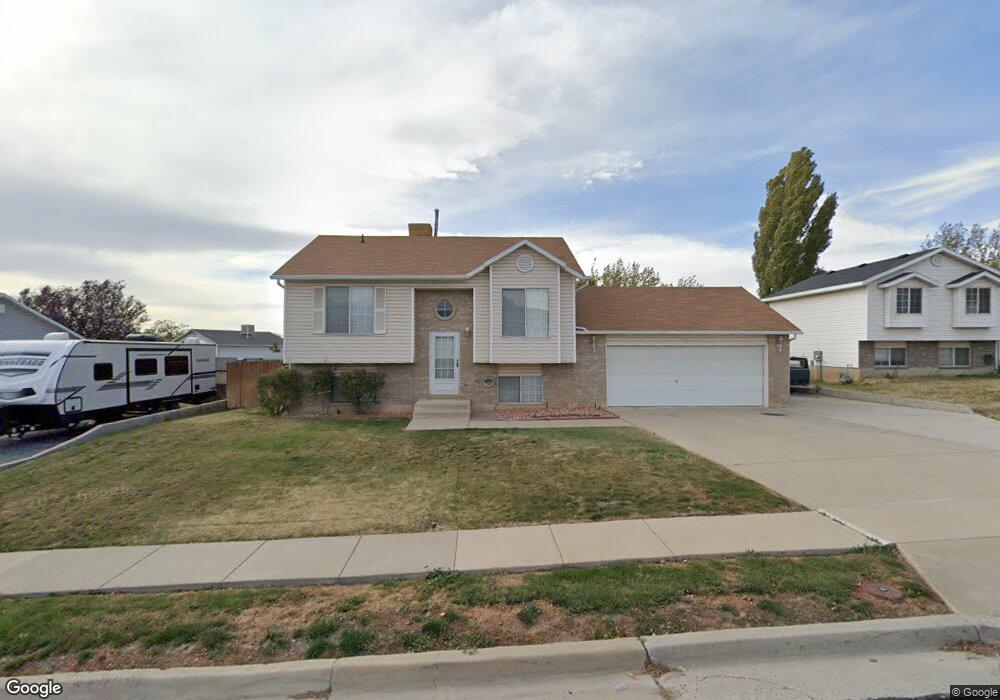
78 N 300 W Clearfield, UT 84015
Estimated Value: $388,000 - $484,000
3
Beds
2
Baths
1,656
Sq Ft
$256/Sq Ft
Est. Value
About This Home
This home is located at 78 N 300 W, Clearfield, UT 84015 and is currently estimated at $423,417, approximately $255 per square foot. 78 N 300 W is a home located in Davis County with nearby schools including Wasatch Elementary School, North Davis Junior High School, and Clearfield High School.
Ownership History
Date
Name
Owned For
Owner Type
Purchase Details
Closed on
Nov 13, 2009
Sold by
Chilcott Daniel W and Chilcott Phyllis A
Bought by
Rodriguez Victor M and Torres Maria M
Current Estimated Value
Home Financials for this Owner
Home Financials are based on the most recent Mortgage that was taken out on this home.
Original Mortgage
$163,975
Outstanding Balance
$106,195
Interest Rate
4.92%
Mortgage Type
FHA
Estimated Equity
$317,222
Purchase Details
Closed on
Jun 23, 2003
Sold by
Bridges Todd J and Mote Candace R
Bought by
Chilcott Daniel W and Chilcott Phyllis A
Purchase Details
Closed on
Aug 27, 1998
Sold by
Wolverton Troy and Wolverton Char K
Bought by
Bridges Todd J and Mote Candace R
Home Financials for this Owner
Home Financials are based on the most recent Mortgage that was taken out on this home.
Original Mortgage
$92,239
Interest Rate
6.91%
Mortgage Type
FHA
Purchase Details
Closed on
Mar 27, 1996
Sold by
Gmw Development Inc
Bought by
Wolverton Troy and Wolverton Char K
Home Financials for this Owner
Home Financials are based on the most recent Mortgage that was taken out on this home.
Original Mortgage
$88,446
Interest Rate
6.98%
Mortgage Type
FHA
Create a Home Valuation Report for This Property
The Home Valuation Report is an in-depth analysis detailing your home's value as well as a comparison with similar homes in the area
Home Values in the Area
Average Home Value in this Area
Purchase History
| Date | Buyer | Sale Price | Title Company |
|---|---|---|---|
| Rodriguez Victor M | -- | Metro National Title | |
| Chilcott Daniel W | -- | Superior Title Company Inc | |
| Bridges Todd J | -- | Equity Title Agency | |
| Wolverton Troy | -- | Bonneville Title Company Inc | |
| Gmw Development Inc | -- | Bonneville Title Company Inc |
Source: Public Records
Mortgage History
| Date | Status | Borrower | Loan Amount |
|---|---|---|---|
| Open | Rodriguez Victor M | $163,975 | |
| Previous Owner | Bridges Todd J | $92,239 | |
| Previous Owner | Wolverton Troy | $88,446 |
Source: Public Records
Tax History Compared to Growth
Tax History
| Year | Tax Paid | Tax Assessment Tax Assessment Total Assessment is a certain percentage of the fair market value that is determined by local assessors to be the total taxable value of land and additions on the property. | Land | Improvement |
|---|---|---|---|---|
| 2025 | $2,228 | $199,650 | $73,665 | $125,985 |
| 2024 | $2,151 | $194,150 | $70,417 | $123,733 |
| 2023 | $1,992 | $330,000 | $112,552 | $217,448 |
| 2022 | $2,117 | $189,750 | $64,333 | $125,417 |
| 2021 | $1,972 | $267,000 | $69,058 | $197,942 |
| 2020 | $1,711 | $230,000 | $58,200 | $171,800 |
| 2019 | $1,665 | $221,000 | $60,541 | $160,459 |
| 2018 | $1,508 | $195,000 | $53,736 | $141,264 |
| 2016 | $1,327 | $89,705 | $21,509 | $68,196 |
| 2015 | $1,259 | $81,180 | $21,509 | $59,671 |
| 2014 | $1,075 | $70,245 | $21,509 | $48,736 |
| 2013 | -- | $67,236 | $30,503 | $36,733 |
Source: Public Records
Map
Nearby Homes
- 265 W 125 N
- 91 N 500 W
- 53 S 150 W
- 75 W 250 N Unit 93
- 75 W 250 N Unit 84
- 75 W 250 N Unit 110
- 75 W 250 N Unit 37
- 75 W 250 N Unit 105
- 160 S 50 W
- 137 W 250 N
- 168 N 500 W
- 482 W 275 N
- 228 N 500 W
- 54 W 250 N
- 158 S Bushnell Way
- 111 Center St Unit 6A
- 111 Center St Unit 3B
- 169 W 400 N
- 180 W 400 N
- 232 N Rick Way