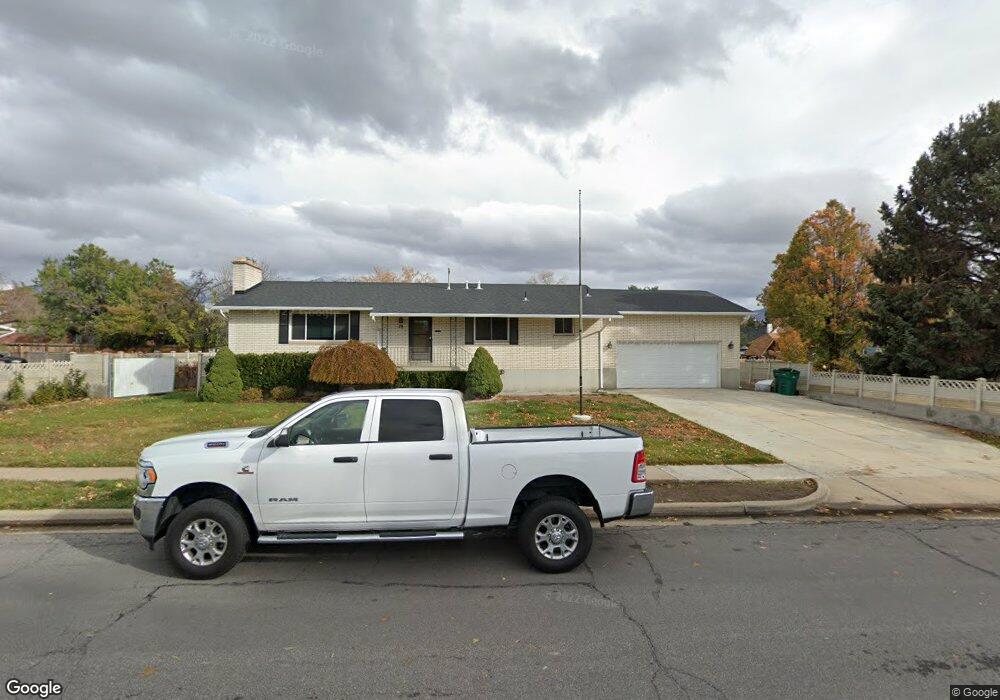
78 N 575 W Layton, UT 84041
Estimated Value: $474,000 - $573,000
4
Beds
3
Baths
1,479
Sq Ft
$359/Sq Ft
Est. Value
About This Home
This home is located at 78 N 575 W, Layton, UT 84041 and is currently estimated at $530,316, approximately $358 per square foot. 78 N 575 W is a home located in Davis County with nearby schools including Layton Elementary School, Fairfield Junior High School, and Layton High School.
Ownership History
Date
Name
Owned For
Owner Type
Purchase Details
Closed on
Oct 10, 2025
Sold by
Smith Ryan B and Smith Erin June
Bought by
Smith Ryan B
Current Estimated Value
Home Financials for this Owner
Home Financials are based on the most recent Mortgage that was taken out on this home.
Original Mortgage
$394,000
Outstanding Balance
$394,000
Interest Rate
6.5%
Mortgage Type
New Conventional
Estimated Equity
$136,316
Purchase Details
Closed on
Jul 18, 2022
Sold by
Maltsberger Dean P
Bought by
Smith Ryan B and Geppert Oliver
Purchase Details
Closed on
Oct 30, 2014
Sold by
Russell Patricia B
Bought by
Maltsberger Dean P and Maltsberger Stacy L
Home Financials for this Owner
Home Financials are based on the most recent Mortgage that was taken out on this home.
Original Mortgage
$184,000
Interest Rate
4.2%
Mortgage Type
VA
Purchase Details
Closed on
Jul 28, 2011
Sold by
Russell Wayne J and Russell Patricia B
Bought by
Russell Wayne J and Russell Patricia B
Home Financials for this Owner
Home Financials are based on the most recent Mortgage that was taken out on this home.
Original Mortgage
$75,500
Interest Rate
3.62%
Mortgage Type
New Conventional
Create a Home Valuation Report for This Property
The Home Valuation Report is an in-depth analysis detailing your home's value as well as a comparison with similar homes in the area
Home Values in the Area
Average Home Value in this Area
Purchase History
| Date | Buyer | Sale Price | Title Company |
|---|---|---|---|
| Smith Ryan B | -- | None Listed On Document | |
| Smith Ryan B | -- | None Listed On Document | |
| Maltsberger Dean P | -- | Aspen Title Insurance | |
| Russell Wayne J | -- | Executive Title Ins A | |
| Russell Wayne J | -- | Executive Title Ins A |
Source: Public Records
Mortgage History
| Date | Status | Borrower | Loan Amount |
|---|---|---|---|
| Open | Smith Ryan B | $394,000 | |
| Previous Owner | Maltsberger Dean P | $184,000 | |
| Previous Owner | Russell Wayne J | $75,500 |
Source: Public Records
Tax History Compared to Growth
Tax History
| Year | Tax Paid | Tax Assessment Tax Assessment Total Assessment is a certain percentage of the fair market value that is determined by local assessors to be the total taxable value of land and additions on the property. | Land | Improvement |
|---|---|---|---|---|
| 2025 | $2,731 | $297,550 | $142,529 | $155,021 |
| 2024 | $2,731 | $288,749 | $150,414 | $138,335 |
| 2023 | $2,495 | $255,750 | $90,035 | $165,714 |
| 2022 | $2,717 | $275,000 | $92,385 | $182,615 |
| 2021 | $2,544 | $384,000 | $138,534 | $245,466 |
| 2020 | $2,306 | $334,000 | $119,167 | $214,833 |
| 2019 | $2,256 | $320,000 | $115,842 | $204,158 |
| 2018 | $2,009 | $286,000 | $102,301 | $183,699 |
| 2016 | $1,750 | $128,535 | $43,520 | $85,015 |
| 2015 | $1,705 | $118,910 | $43,520 | $75,390 |
| 2014 | $1,764 | $125,803 | $43,520 | $82,283 |
| 2013 | -- | $97,351 | $37,846 | $59,505 |
Source: Public Records
Map
Nearby Homes
- 485 W 100 N
- 750 W Gentile St
- 356 W 25 N
- 355 W Gentile St
- 65 Ronald Ave
- 6 Grover St
- 933 W Gentile St
- 267 S Melody St
- 526 King St Unit 2
- 296 S 950 W
- 362 S 950 W
- 480 Spurlock St
- 142 Green Dr
- 562 S 850 W
- 441 Church St
- 557 S Angel St
- 774 W Farming Way
- 1677 N 1600 W Unit 134
- 910 N Laverde Ave W
- Browning Plan at Amber Fields