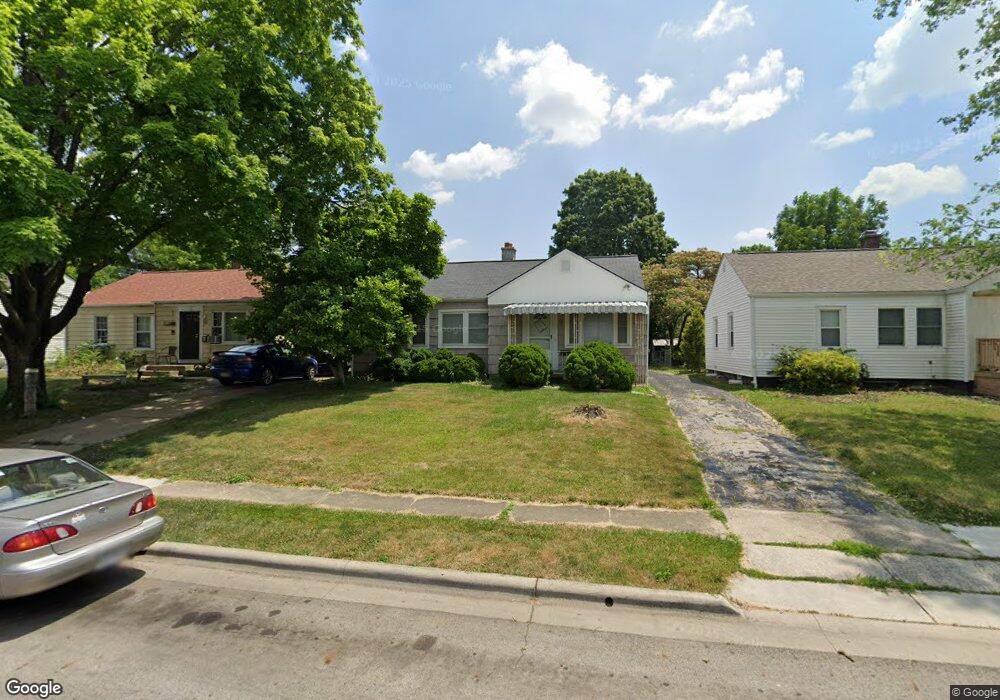
78 N Everett Ave Columbus, OH 43213
Broadleigh NeighborhoodEstimated Value: $214,000 - $227,000
3
Beds
2
Baths
1,295
Sq Ft
$169/Sq Ft
Est. Value
About This Home
This home is located at 78 N Everett Ave, Columbus, OH 43213 and is currently estimated at $219,388, approximately $169 per square foot. 78 N Everett Ave is a home located in Franklin County with nearby schools including Broadleigh Elementary School, Johnson Park Middle School, and Walnut Ridge High School.
Ownership History
Date
Name
Owned For
Owner Type
Purchase Details
Closed on
Jun 29, 2010
Sold by
Martin Julie A
Bought by
Mccann William G
Current Estimated Value
Home Financials for this Owner
Home Financials are based on the most recent Mortgage that was taken out on this home.
Original Mortgage
$55,564
Outstanding Balance
$37,771
Interest Rate
5.5%
Mortgage Type
FHA
Estimated Equity
$181,617
Purchase Details
Closed on
Feb 24, 2004
Sold by
Martin Evelyn and Martin Evelyn M
Bought by
Martin Julie A
Purchase Details
Closed on
Feb 20, 2004
Sold by
Estate Of George V Martin
Bought by
Martin Evelyn M
Purchase Details
Closed on
May 16, 1994
Bought by
Martin Julie A
Create a Home Valuation Report for This Property
The Home Valuation Report is an in-depth analysis detailing your home's value as well as a comparison with similar homes in the area
Home Values in the Area
Average Home Value in this Area
Purchase History
| Date | Buyer | Sale Price | Title Company |
|---|---|---|---|
| Mccann William G | $57,000 | Hayes Titl | |
| Martin Julie A | -- | -- | |
| Martin Evelyn M | -- | -- | |
| Martin Julie A | $57,000 | -- |
Source: Public Records
Mortgage History
| Date | Status | Borrower | Loan Amount |
|---|---|---|---|
| Open | Mccann William G | $55,564 |
Source: Public Records
Tax History
| Year | Tax Paid | Tax Assessment Tax Assessment Total Assessment is a certain percentage of the fair market value that is determined by local assessors to be the total taxable value of land and additions on the property. | Land | Improvement |
|---|---|---|---|---|
| 2025 | $3,183 | $70,920 | $18,030 | $52,890 |
| 2024 | $3,183 | $70,920 | $18,030 | $52,890 |
| 2023 | $3,142 | $70,910 | $18,025 | $52,885 |
| 2022 | $2,199 | $42,390 | $6,760 | $35,630 |
| 2021 | $2,202 | $42,390 | $6,760 | $35,630 |
| 2020 | $2,205 | $42,390 | $6,760 | $35,630 |
| 2019 | $2,166 | $35,710 | $5,640 | $30,070 |
| 2018 | $1,812 | $35,710 | $5,640 | $30,070 |
| 2017 | $2,165 | $35,710 | $5,640 | $30,070 |
| 2016 | $1,612 | $24,330 | $4,170 | $20,160 |
| 2015 | $1,463 | $24,330 | $4,170 | $20,160 |
| 2014 | $1,467 | $24,330 | $4,170 | $20,160 |
| 2013 | $761 | $25,585 | $4,375 | $21,210 |
Source: Public Records
Map
Nearby Homes
- 73 N Hampton Rd
- 50 N Hampton Rd
- 73 N Everett Ave
- 194 N Kellner Rd
- 68 S Weyant Ave
- 157 N Kellner Rd
- 253 N James Rd
- 177 N James Rd
- 243 N James Rd
- 256 N Kellner Rd
- 3191 E Broad St
- 238 Edgevale Rd
- 177 S Hampton Rd
- 181 S Weyant Ave
- 91 Maplewood Ave
- 180 N Harding Rd
- 228 S Ashburton Rd
- 181 S Kellner Rd
- 290 S Hampton Rd
- 3755 Doney St
- 72 N Everett Ave
- 86 N Everett Ave
- 68 N Everett Ave
- 94 N Everett Ave
- 96 N Everett Ave
- 63 N Hampton Rd Unit 4
- 60 N Everett Ave
- 98 N Everett Ave
- 79 N Everett Ave
- 87 N Everett Ave
- 52 N Everett Ave
- 81 N Hampton Rd Unit A
- 81 N Hampton Rd
- 106 N Everett Ave
- 55 N Hampton Rd Unit B
- 55 N Hampton Rd Unit B
- 55 N Hampton Rd
- 93 N Everett Ave
- 89 N Hampton Rd
- 67 N Everett Ave
Your Personal Tour Guide
Ask me questions while you tour the home.