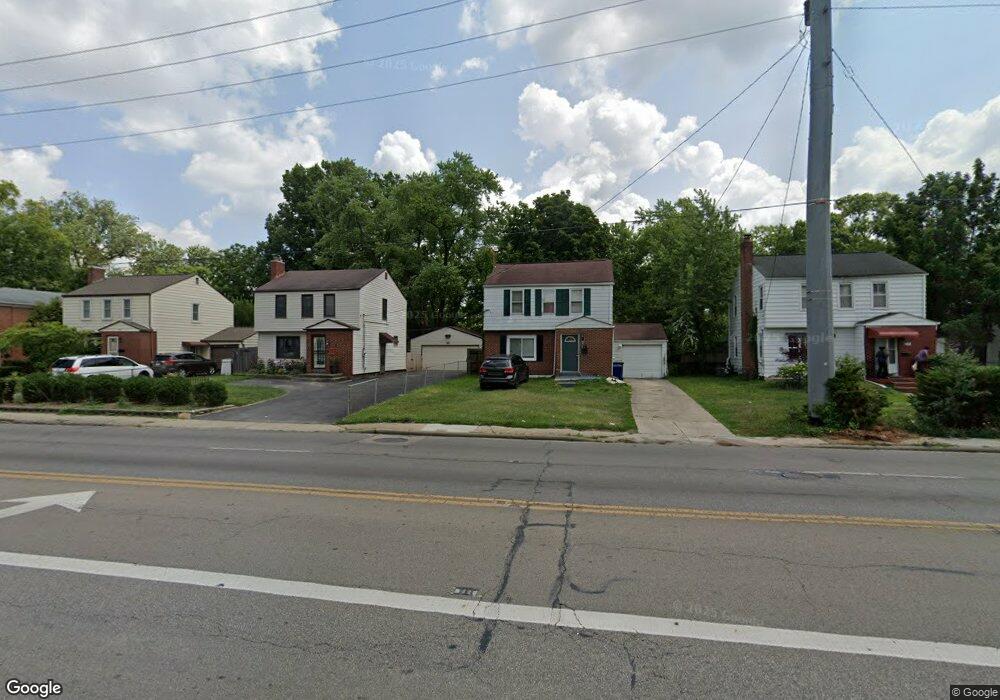
78 N James Rd Columbus, OH 43213
Broadleigh NeighborhoodEstimated Value: $175,000 - $203,000
3
Beds
1
Bath
1,166
Sq Ft
$165/Sq Ft
Est. Value
About This Home
This home is located at 78 N James Rd, Columbus, OH 43213 and is currently estimated at $192,032, approximately $164 per square foot. 78 N James Rd is a home located in Franklin County with nearby schools including Broadleigh Elementary School, Johnson Park Middle School, and Walnut Ridge High School.
Ownership History
Date
Name
Owned For
Owner Type
Purchase Details
Closed on
Nov 22, 2022
Sold by
Ira Fund Ii Llc
Bought by
City Of Columbus Ohio
Current Estimated Value
Purchase Details
Closed on
Nov 7, 2022
Sold by
Ira Fund Ii Llc
Bought by
City Of Columbus Ohio
Purchase Details
Closed on
Sep 30, 2021
Sold by
Rs Cs Properties Llc
Bought by
Ira Fund Ii Llc
Home Financials for this Owner
Home Financials are based on the most recent Mortgage that was taken out on this home.
Original Mortgage
$82,500
Interest Rate
2.8%
Mortgage Type
New Conventional
Purchase Details
Closed on
Dec 12, 2002
Sold by
Hud
Bought by
Clark Richard A
Home Financials for this Owner
Home Financials are based on the most recent Mortgage that was taken out on this home.
Original Mortgage
$52,000
Interest Rate
6.5%
Mortgage Type
Purchase Money Mortgage
Purchase Details
Closed on
Mar 8, 2002
Sold by
Brooks Todd E and The Leader Mtg Company
Bought by
Hud
Purchase Details
Closed on
Sep 25, 1990
Bought by
Brooks Todd E and Brooks Yvonne
Purchase Details
Closed on
Jan 1, 1987
Create a Home Valuation Report for This Property
The Home Valuation Report is an in-depth analysis detailing your home's value as well as a comparison with similar homes in the area
Home Values in the Area
Average Home Value in this Area
Purchase History
| Date | Buyer | Sale Price | Title Company |
|---|---|---|---|
| City Of Columbus Ohio | -- | None Listed On Document | |
| City Of Columbus Ohio | -- | -- | |
| Ira Fund Ii Llc | $110,000 | Transcounty Title Agency Llc | |
| Clark Richard A | $44,496 | Lakeside Title & Escrow Agen | |
| Hud | $38,600 | Independent Title | |
| Brooks Todd E | $52,900 | -- | |
| -- | -- | -- |
Source: Public Records
Mortgage History
| Date | Status | Borrower | Loan Amount |
|---|---|---|---|
| Previous Owner | Ira Fund Ii Llc | $82,500 | |
| Previous Owner | Clark Richard A | $52,000 |
Source: Public Records
Tax History
| Year | Tax Paid | Tax Assessment Tax Assessment Total Assessment is a certain percentage of the fair market value that is determined by local assessors to be the total taxable value of land and additions on the property. | Land | Improvement |
|---|---|---|---|---|
| 2025 | $3,293 | $71,860 | $20,020 | $51,840 |
| 2024 | $3,293 | $71,860 | $20,020 | $51,840 |
| 2023 | $3,402 | $71,855 | $20,020 | $51,835 |
| 2022 | $2,520 | $44,590 | $7,420 | $37,170 |
| 2021 | $2,374 | $44,590 | $7,420 | $37,170 |
| 2020 | $2,410 | $44,590 | $7,420 | $37,170 |
| 2019 | $2,351 | $37,810 | $6,200 | $31,610 |
| 2018 | $1,875 | $37,810 | $6,200 | $31,610 |
| 2017 | $1,946 | $37,810 | $6,200 | $31,610 |
| 2016 | $1,541 | $22,680 | $4,200 | $18,480 |
| 2015 | $1,403 | $22,680 | $4,200 | $18,480 |
| 2014 | $1,406 | $22,680 | $4,200 | $18,480 |
| 2013 | $730 | $23,870 | $4,410 | $19,460 |
Source: Public Records
Map
Nearby Homes
- 73 N Everett Ave
- 157 N Kellner Rd
- 73 N Hampton Rd
- 194 N Kellner Rd
- 50 N Hampton Rd
- 3191 E Broad St
- 253 N James Rd
- 177 N James Rd
- 243 N James Rd
- 256 N Kellner Rd
- 238 Edgevale Rd
- 180 N Harding Rd
- 68 S Weyant Ave
- 177 S Hampton Rd
- 181 S Kellner Rd
- 181 S Weyant Ave
- 228 S Ashburton Rd
- 50 S Chesterfield Rd
- 279 S Ashburton Rd
- 277 S James Rd
- 70 N James Rd
- 84 N James Rd
- 64 N James Rd
- 92 N James Rd
- 56 N James Rd
- 65 N Ashburton Rd
- 73 N Ashburton Rd
- 102 N James Rd
- 59 N Ashburton Rd
- 52 N James Rd
- 81 N Ashburton Rd
- 81 N Ashburton Rd
- 51 N Ashburton Rd
- 87 N Ashburton Rd
- 73 N James Rd
- 40 N James Rd
- 95 N James Rd
- 110 N James Rd
- 45 N Ashburton Rd
- 63 N James Rd
Your Personal Tour Guide
Ask me questions while you tour the home.