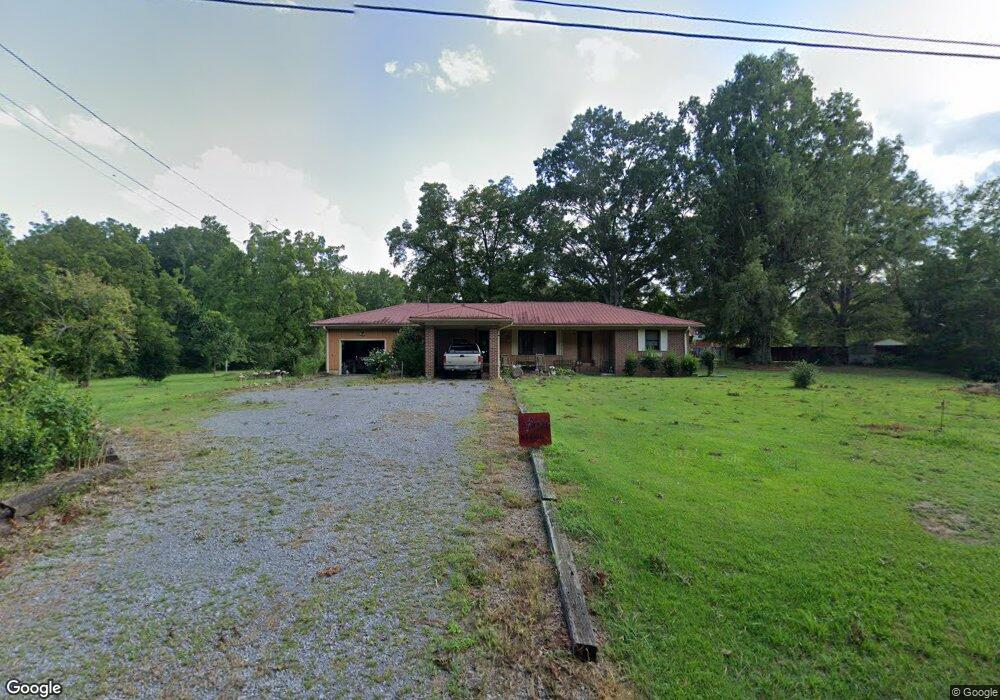
78 Parson Rd Chatsworth, GA 30705
Estimated Value: $236,387 - $283,000
Studio
2
Baths
1,608
Sq Ft
$162/Sq Ft
Est. Value
About This Home
This home is located at 78 Parson Rd, Chatsworth, GA 30705 and is currently estimated at $260,847, approximately $162 per square foot. 78 Parson Rd is a home located in Murray County with nearby schools including Coker Elementary School, Gladden Middle School, and Murray County High School.
Ownership History
Date
Name
Owned For
Owner Type
Purchase Details
Closed on
Feb 13, 1996
Sold by
Owens Ann S
Bought by
Sosebee Bradley E
Current Estimated Value
Create a Home Valuation Report for This Property
The Home Valuation Report is an in-depth analysis detailing your home's value as well as a comparison with similar homes in the area
Home Values in the Area
Average Home Value in this Area
Purchase History
| Date | Buyer | Sale Price | Title Company |
|---|---|---|---|
| Sosebee Bradley E | $100,000 | -- |
Source: Public Records
Tax History
| Year | Tax Paid | Tax Assessment Tax Assessment Total Assessment is a certain percentage of the fair market value that is determined by local assessors to be the total taxable value of land and additions on the property. | Land | Improvement |
|---|---|---|---|---|
| 2024 | $321 | $83,188 | $12,120 | $71,068 |
| 2023 | $334 | $89,288 | $12,120 | $77,168 |
| 2022 | $334 | $78,288 | $11,520 | $66,768 |
| 2021 | $359 | $65,208 | $11,520 | $53,688 |
| 2020 | $359 | $57,088 | $11,000 | $46,088 |
| 2019 | $362 | $57,088 | $11,000 | $46,088 |
| 2018 | $362 | $57,088 | $11,000 | $46,088 |
| 2017 | $0 | $50,928 | $10,280 | $40,648 |
| 2016 | $267 | $49,096 | $15,800 | $33,296 |
| 2015 | -- | $49,096 | $15,800 | $33,296 |
| 2014 | -- | $49,096 | $15,800 | $33,296 |
| 2013 | -- | $49,096 | $15,800 | $33,296 |
Source: Public Records
Map
Nearby Homes
- 456 Cherokee Ln
- 553 Cherokee Ln
- 111 Long Dr
- 528 Magnolia Ln
- 132 Katie Ln
- 23 Brandon Ln
- 0 Highway 52 Unit 417342
- 0 Highway 52 Unit 1516971
- 0 Highway 52 Unit 10573726
- 0 Highway 52 Unit 415667
- 53 South Way
- 297 Murray Springs Rd
- 357 Katie Ln
- 80 Columbus Dr
- 41 Timberidge Dr
- 0 Wilson Rd Unit 25369335
- 74 Wilson Rd
- 86 Wilson Rd
- DUPONT Plan at Urban's Place
- BEAUMONT Plan at Urban's Place
- 110 Parson Rd
- 79 Parson Rd
- 1045 Sitton Rd S
- 140 Parson Rd
- 1091 Sitton Rd S
- 1011 Sitton Rd S
- 1147 Sitton Rd S
- 162 Parson Rd
- 1146 Sitton Rd S
- 107 Baggett Rd
- 895 Sitton Rd S
- 1064 Sitton Rd S
- 71 Cherokee Ln
- 213 Baggett Rd
- 241 Parson Rd
- 1198 Sitton Rd S
- 896 Sitton Rd S
- 859 Sitton Rd S
- 128 Baggett Rd
- 1240 Sitton Rd S
Your Personal Tour Guide
Ask me questions while you tour the home.