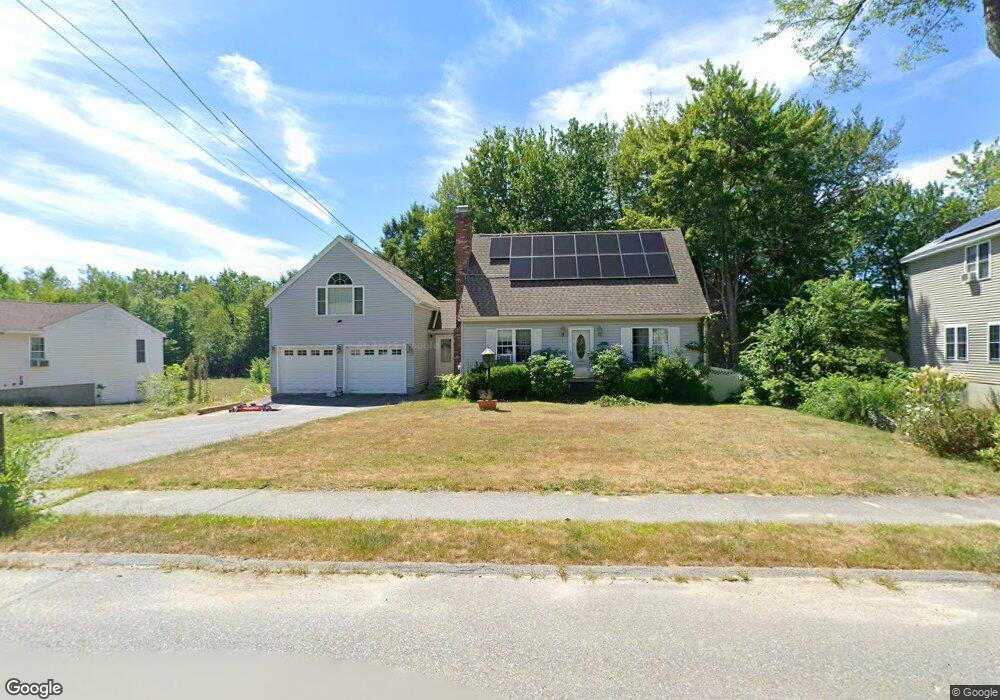
78 Pearly Ln Gardner, MA 01440
Estimated Value: $387,000 - $443,000
3
Beds
1
Bath
1,373
Sq Ft
$301/Sq Ft
Est. Value
About This Home
This home is located at 78 Pearly Ln, Gardner, MA 01440 and is currently estimated at $413,221, approximately $300 per square foot. 78 Pearly Ln is a home located in Worcester County with nearby schools including Gardner High School, Holy Family Academy, and Wachusett Hills Christian School.
Ownership History
Date
Name
Owned For
Owner Type
Purchase Details
Closed on
Nov 30, 2017
Sold by
Bresnahan John W
Bought by
Bresnahan John W and Bresnahan Shauna L
Current Estimated Value
Purchase Details
Closed on
Nov 24, 2008
Sold by
Fhlmc
Bought by
Bresnahan John W
Home Financials for this Owner
Home Financials are based on the most recent Mortgage that was taken out on this home.
Original Mortgage
$138,700
Interest Rate
6.03%
Mortgage Type
Purchase Money Mortgage
Purchase Details
Closed on
Apr 8, 2008
Sold by
Goff Daniel J and Wells Fargo Bk
Bought by
Fhlmc
Purchase Details
Closed on
Sep 8, 2003
Sold by
Nash Carleton David
Bought by
Goff Daniel J
Home Financials for this Owner
Home Financials are based on the most recent Mortgage that was taken out on this home.
Original Mortgage
$197,911
Interest Rate
6.02%
Mortgage Type
Purchase Money Mortgage
Purchase Details
Closed on
Oct 16, 1997
Sold by
Kelsey Rt and Donell Conrad J
Bought by
Nash C David and Nash Patricia L
Create a Home Valuation Report for This Property
The Home Valuation Report is an in-depth analysis detailing your home's value as well as a comparison with similar homes in the area
Home Values in the Area
Average Home Value in this Area
Purchase History
| Date | Buyer | Sale Price | Title Company |
|---|---|---|---|
| Bresnahan John W | -- | -- | |
| Bresnahan John W | $146,000 | -- | |
| Fhlmc | $205,590 | -- | |
| Goff Daniel J | $200,000 | -- | |
| Nash C David | $96,900 | -- |
Source: Public Records
Mortgage History
| Date | Status | Borrower | Loan Amount |
|---|---|---|---|
| Previous Owner | Nash C David | $161,000 | |
| Previous Owner | Bresnahan John W | $138,700 | |
| Previous Owner | Goff Daniel J | $197,911 | |
| Previous Owner | Nash C David | $108,000 | |
| Previous Owner | Nash C David | $34,000 |
Source: Public Records
Tax History Compared to Growth
Tax History
| Year | Tax Paid | Tax Assessment Tax Assessment Total Assessment is a certain percentage of the fair market value that is determined by local assessors to be the total taxable value of land and additions on the property. | Land | Improvement |
|---|---|---|---|---|
| 2025 | $50 | $349,900 | $74,800 | $275,100 |
| 2024 | $5,169 | $344,800 | $68,000 | $276,800 |
| 2023 | $4,776 | $296,100 | $67,000 | $229,100 |
| 2022 | $4,874 | $262,200 | $50,700 | $211,500 |
| 2021 | $4,749 | $237,000 | $44,100 | $192,900 |
| 2020 | $4,678 | $237,000 | $44,100 | $192,900 |
| 2019 | $4,473 | $222,100 | $44,100 | $178,000 |
| 2018 | $4,236 | $209,000 | $44,100 | $164,900 |
| 2017 | $3,979 | $194,300 | $44,100 | $150,200 |
| 2016 | $3,746 | $183,000 | $44,100 | $138,900 |
| 2015 | $3,544 | $177,400 | $44,100 | $133,300 |
| 2014 | $3,180 | $168,500 | $49,000 | $119,500 |
Source: Public Records
Map
Nearby Homes
- 85 Ridgewood Ln Unit 18
- 53 Ridgewood Ln Unit 16
- 84 Murray Rd
- 0 Pearl St Unit 73213938
- 213 Woodland Ave
- 30 Foster Ct
- 87 Crestwood Dr
- 21 Crestwood Dr
- 35 Cedar St Unit 6
- 52 Central St
- 33 S Main St
- 65 School St
- 66 S Main St
- 135 Temple St
- 253-255 Park St
- 14 S School St
- 94 Maple St
- 104 Maple St
- 104 Lake St Unit 104
- 68 Olde Colonial Dr Unit 6