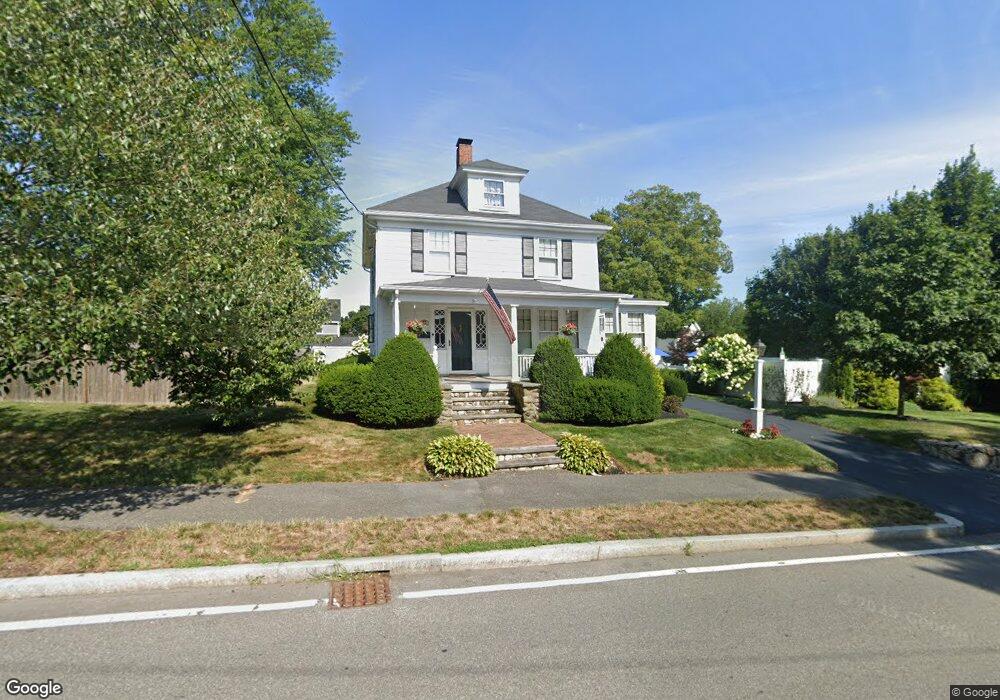
78 Pine St Danvers, MA 01923
Estimated Value: $650,000 - $903,000
3
Beds
2
Baths
1,660
Sq Ft
$435/Sq Ft
Est. Value
About This Home
This home is located at 78 Pine St, Danvers, MA 01923 and is currently estimated at $722,921, approximately $435 per square foot. 78 Pine St is a home located in Essex County with nearby schools including Danvers High School, St. Mary of the Annunciation School, and St. John's Prep.
Ownership History
Date
Name
Owned For
Owner Type
Purchase Details
Closed on
Aug 2, 2018
Sold by
Arlander Katherine T and Arlander Lance C
Bought by
Arlander Ft
Current Estimated Value
Purchase Details
Closed on
Nov 28, 2011
Sold by
Arlander Lance C and Arlander Katherine R
Bought by
Arlander Lance C
Purchase Details
Closed on
Feb 28, 1995
Sold by
Larivee Robert J and Larivee Mary
Bought by
Arlander Lance C
Create a Home Valuation Report for This Property
The Home Valuation Report is an in-depth analysis detailing your home's value as well as a comparison with similar homes in the area
Home Values in the Area
Average Home Value in this Area
Purchase History
| Date | Buyer | Sale Price | Title Company |
|---|---|---|---|
| Arlander Ft | -- | -- | |
| Arlander Lance C | -- | -- | |
| Arlander Lance C | $186,000 | -- |
Source: Public Records
Mortgage History
| Date | Status | Borrower | Loan Amount |
|---|---|---|---|
| Previous Owner | Arlander Lance C | $250,000 | |
| Previous Owner | Arlander Lance C | $184,000 | |
| Previous Owner | Arlander Lance C | $50,000 |
Source: Public Records
Tax History
| Year | Tax Paid | Tax Assessment Tax Assessment Total Assessment is a certain percentage of the fair market value that is determined by local assessors to be the total taxable value of land and additions on the property. | Land | Improvement |
|---|---|---|---|---|
| 2025 | $6,337 | $576,600 | $336,700 | $239,900 |
| 2024 | $6,287 | $565,900 | $336,700 | $229,200 |
| 2023 | $5,908 | $502,800 | $288,700 | $214,100 |
| 2022 | $5,710 | $451,000 | $252,700 | $198,300 |
| 2021 | $5,088 | $381,100 | $207,100 | $174,000 |
| 2020 | $5,517 | $422,400 | $207,100 | $215,300 |
| 2019 | $5,807 | $437,300 | $216,700 | $220,600 |
| 2018 | $5,526 | $408,100 | $214,300 | $193,800 |
| 2017 | $5,606 | $395,100 | $208,300 | $186,800 |
| 2016 | $5,399 | $380,200 | $198,700 | $181,500 |
| 2015 | $4,661 | $312,600 | $180,700 | $131,900 |
Source: Public Records
Map
Nearby Homes
- 10 Clark St
- 18 Wadsworth St
- 14 Williams St Unit C17
- 43 Hobart St Unit B
- 6 Venice St Unit B3
- 22 Maple Ave
- 5 Holten St
- 63 Adams St
- 35 Locust St Unit 3
- 97 Sylvan St Unit 7
- 102 Centre St
- 35 High St Unit 3D
- 20 Central Ave
- 14 Chase St
- 2 Chapel Rd
- 11 Spring St
- 6 Grant St
- 11 Andover St
- 108 Abington Rd Unit 108
- 14 Grove St
Your Personal Tour Guide
Ask me questions while you tour the home.