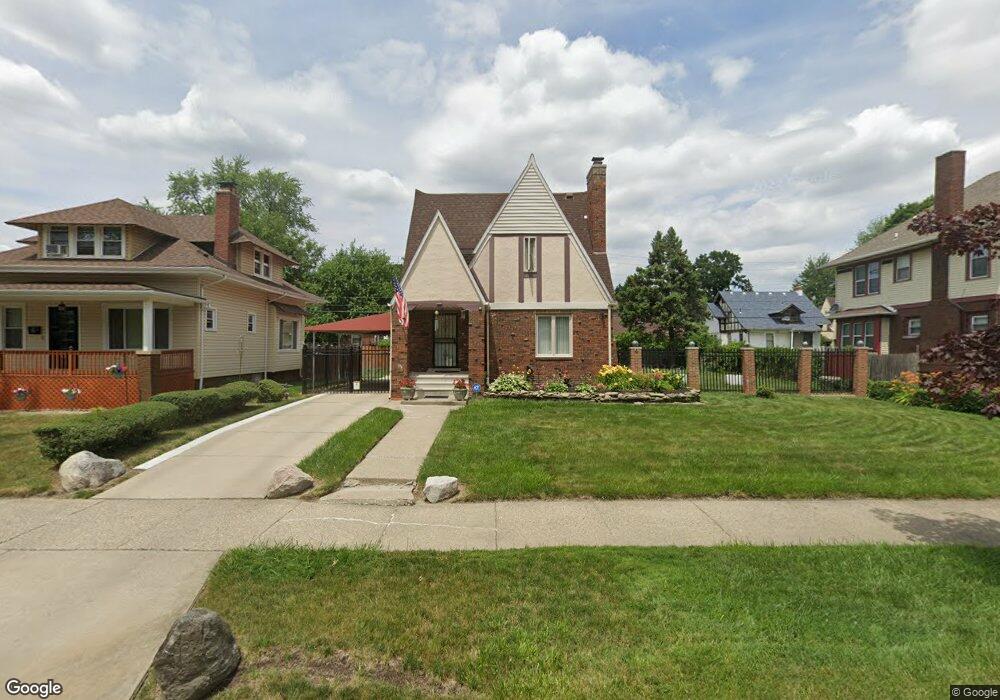
78 Puritan St Highland Park, MI 48203
Estimated Value: $107,000 - $184,000
--
Bed
1
Bath
1,820
Sq Ft
$84/Sq Ft
Est. Value
About This Home
This home is located at 78 Puritan St, Highland Park, MI 48203 and is currently estimated at $152,560, approximately $83 per square foot. 78 Puritan St is a home located in Wayne County with nearby schools including George Washington Carver Elementary School, Barber Elementary School, and Sigma Academy for Leadership & Early Middle College.
Ownership History
Date
Name
Owned For
Owner Type
Purchase Details
Closed on
Dec 20, 2012
Sold by
Johnson Arthur D and Johnson Arthur
Bought by
Rbs Citizens Na and Citizens Bank Na
Current Estimated Value
Purchase Details
Closed on
Jul 11, 2002
Sold by
Jones Mcneal
Bought by
Johnson Arthur
Purchase Details
Closed on
Oct 3, 1994
Sold by
Lisa H Stevenson
Bought by
Brenda J Walls
Home Financials for this Owner
Home Financials are based on the most recent Mortgage that was taken out on this home.
Original Mortgage
$42,000
Interest Rate
8.55%
Mortgage Type
New Conventional
Create a Home Valuation Report for This Property
The Home Valuation Report is an in-depth analysis detailing your home's value as well as a comparison with similar homes in the area
Home Values in the Area
Average Home Value in this Area
Purchase History
| Date | Buyer | Sale Price | Title Company |
|---|---|---|---|
| Rbs Citizens Na | $1,800 | None Available | |
| Johnson Arthur | $95,000 | -- | |
| Brenda J Walls | $44,900 | -- |
Source: Public Records
Mortgage History
| Date | Status | Borrower | Loan Amount |
|---|---|---|---|
| Previous Owner | Brenda J Walls | $42,000 |
Source: Public Records
Tax History Compared to Growth
Tax History
| Year | Tax Paid | Tax Assessment Tax Assessment Total Assessment is a certain percentage of the fair market value that is determined by local assessors to be the total taxable value of land and additions on the property. | Land | Improvement |
|---|---|---|---|---|
| 2025 | $1,021 | $59,600 | $0 | $0 |
| 2024 | $1,021 | $53,800 | $0 | $0 |
| 2023 | $980 | $48,300 | $0 | $0 |
| 2022 | $1,178 | $35,500 | $0 | $0 |
| 2021 | $1,156 | $24,400 | $0 | $0 |
| 2019 | $1,232 | $17,500 | $0 | $0 |
| 2018 | $1,007 | $15,200 | $0 | $0 |
| 2017 | $477 | $15,100 | $0 | $0 |
| 2016 | $1,793 | $19,700 | $0 | $0 |
| 2015 | $2,430 | $24,300 | $0 | $0 |
| 2013 | $3,470 | $34,700 | $0 | $0 |
| 2012 | $2,374 | $37,700 | $9,300 | $28,400 |
Source: Public Records
Map
Nearby Homes