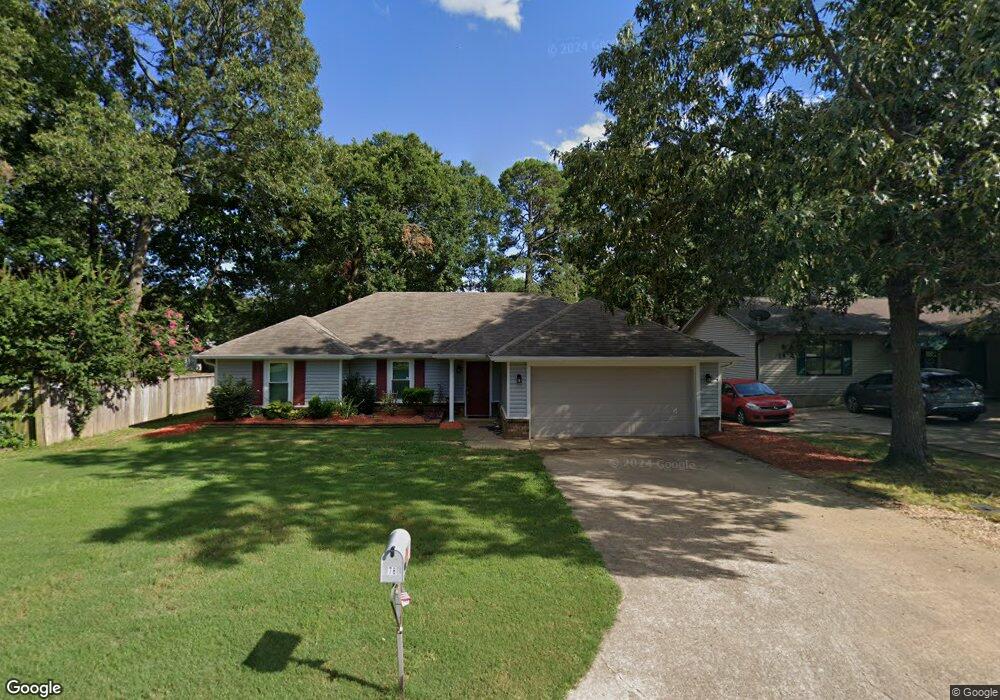
78 Rolling Oaks Dr Maumelle, AR 72113
Estimated Value: $206,928 - $231,000
--
Bed
2
Baths
1,460
Sq Ft
$153/Sq Ft
Est. Value
About This Home
This home is located at 78 Rolling Oaks Dr, Maumelle, AR 72113 and is currently estimated at $222,982, approximately $152 per square foot. 78 Rolling Oaks Dr is a home located in Pulaski County with nearby schools including Pine Forest Elementary School, Maumelle Middle School, and Maumelle High School.
Ownership History
Date
Name
Owned For
Owner Type
Purchase Details
Closed on
Apr 29, 2020
Sold by
Hires Alberta Faye and Powell Albert Faye
Bought by
Hires Lester Joe and Hires Alberta Faye
Current Estimated Value
Purchase Details
Closed on
Mar 15, 2013
Sold by
Powell Scottie Lynn
Bought by
Powell Alberta Faye
Purchase Details
Closed on
Jul 12, 2001
Sold by
Burress Christopher W and Burress Carrie Marle
Bought by
Powell Scottie L and Powell Alberta Faye
Home Financials for this Owner
Home Financials are based on the most recent Mortgage that was taken out on this home.
Original Mortgage
$104,754
Outstanding Balance
$40,487
Interest Rate
7.18%
Mortgage Type
VA
Estimated Equity
$182,495
Purchase Details
Closed on
Jul 10, 1998
Sold by
Martin Scott Kendall and Martin Lisa Pehosh
Bought by
Burress Christopher W and Burress Carrie Marie
Home Financials for this Owner
Home Financials are based on the most recent Mortgage that was taken out on this home.
Original Mortgage
$90,235
Interest Rate
7.08%
Mortgage Type
FHA
Create a Home Valuation Report for This Property
The Home Valuation Report is an in-depth analysis detailing your home's value as well as a comparison with similar homes in the area
Home Values in the Area
Average Home Value in this Area
Purchase History
| Date | Buyer | Sale Price | Title Company |
|---|---|---|---|
| Hires Lester Joe | -- | None Available | |
| Powell Alberta Faye | -- | None Available | |
| Powell Scottie L | $103,000 | Stewart Title | |
| Burress Christopher W | $90,000 | -- |
Source: Public Records
Mortgage History
| Date | Status | Borrower | Loan Amount |
|---|---|---|---|
| Open | Powell Scottie L | $104,754 | |
| Previous Owner | Burress Christopher W | $90,235 |
Source: Public Records
Tax History Compared to Growth
Tax History
| Year | Tax Paid | Tax Assessment Tax Assessment Total Assessment is a certain percentage of the fair market value that is determined by local assessors to be the total taxable value of land and additions on the property. | Land | Improvement |
|---|---|---|---|---|
| 2025 | $1,503 | $34,727 | $5,800 | $28,927 |
| 2024 | $1,679 | $34,727 | $5,800 | $28,927 |
| 2023 | $1,679 | $34,727 | $5,800 | $28,927 |
| 2022 | $1,503 | $34,727 | $5,800 | $28,927 |
| 2021 | $1,679 | $26,700 | $5,600 | $21,100 |
| 2020 | $1,304 | $26,700 | $5,600 | $21,100 |
| 2019 | $1,304 | $26,700 | $5,600 | $21,100 |
| 2018 | $1,329 | $26,700 | $5,600 | $21,100 |
| 2017 | $1,329 | $26,700 | $5,600 | $21,100 |
| 2016 | $1,466 | $28,870 | $5,800 | $23,070 |
| 2015 | $1,816 | $28,870 | $5,800 | $23,070 |
| 2014 | $1,816 | $0 | $0 | $0 |
Source: Public Records
Map
Nearby Homes
- 78 Garden Oaks Dr
- 37 Garden Oaks Dr
- 18 Willow Oak Loop
- 10 Willow Oak Loop
- 9 Smoking Oaks Dr
- 9 Oak Ridge Dr
- 0 Hwy 365 N Unit Tanning Rd South
- 2 Kingspark Dr
- 21600 Highway 365 N
- 58 Vantage Dr
- 31 Kingspark Dr
- 43 Prince Dr
- 40 Prince Dr
- Lot 6 Burkhalter Industrial Dr
- Lot 7 Burkhalter Industrial Dr
- 14400 Stonebrook Ln
- 81 Meadow Ridge Loop
- 14404 Stonebrook Ln
- 14615 Stonebrook Ln
- 101 Pine Forest Dr
- 80 Rolling Oaks Dr
- 2 High Timber Dr
- 4 High Timber Dr
- 4 High Timber Cove
- 82 Rolling Oaks Dr
- 6 High Timber Cove
- 6 High Timber Dr
- 77 Rolling Oaks Dr
- 75 Rolling Oaks Dr
- 0 High Timber Dr
- 79 Rolling Oaks Dr
- 50 High Timber Dr
- 73 Rolling Oaks Dr
- 48 High Timber Dr
- 71 Rolling Oaks Dr
- 1 High Timber Dr
- 3 High Timber Dr
- 10 High Timber Dr
- 46 High Timber Dr
- 7 High Timber Cove