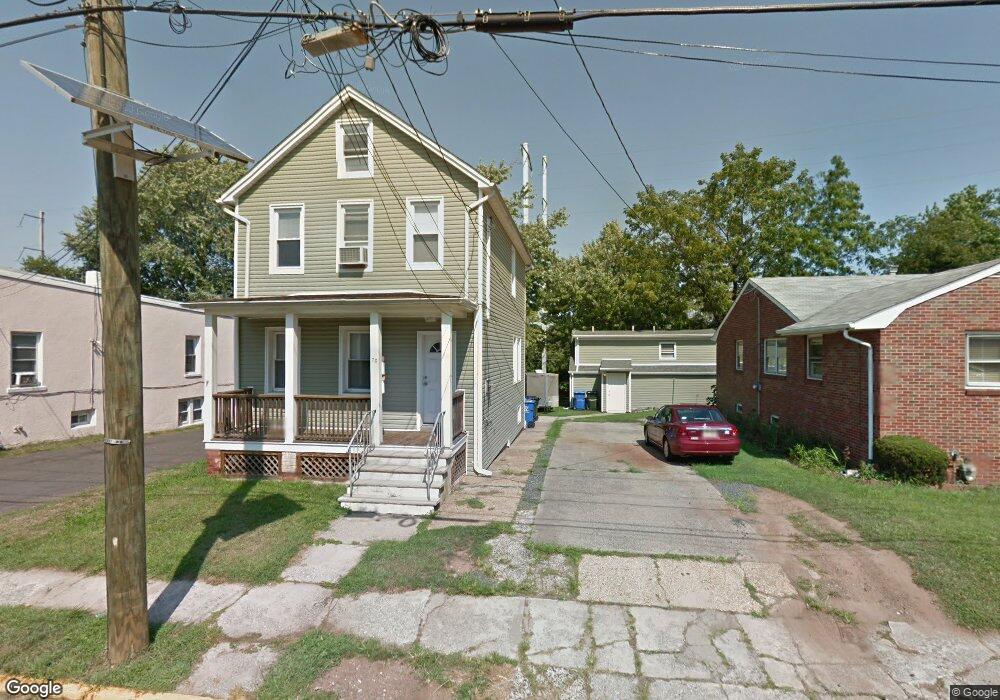
78 S Fulton St Woodbridge Township, NJ 07095
Estimated Value: $459,698 - $618,000
4
Beds
3
Baths
2,151
Sq Ft
$258/Sq Ft
Est. Value
About This Home
This home is located at 78 S Fulton St, Woodbridge Township, NJ 07095 and is currently estimated at $555,175, approximately $258 per square foot. 78 S Fulton St is a home located in Middlesex County with nearby schools including Ross Street Elementary School, Woodbridge Middle School, and Woodbridge High School.
Ownership History
Date
Name
Owned For
Owner Type
Purchase Details
Closed on
Feb 13, 2020
Sold by
Chappeland Holdings Llc
Bought by
The Township Of Woodbridge
Current Estimated Value
Purchase Details
Closed on
Jun 5, 2019
Sold by
Labracio Peter D
Bought by
Chappeland Holdings Llc
Purchase Details
Closed on
Jan 16, 1986
Bought by
Labracio Peter D
Create a Home Valuation Report for This Property
The Home Valuation Report is an in-depth analysis detailing your home's value as well as a comparison with similar homes in the area
Home Values in the Area
Average Home Value in this Area
Purchase History
| Date | Buyer | Sale Price | Title Company |
|---|---|---|---|
| The Township Of Woodbridge | -- | None Available | |
| Chappeland Holdings Llc | $335,000 | Prestige Nj Ttl Agcy Inc | |
| Labracio Peter D | $80,000 | -- |
Source: Public Records
Tax History Compared to Growth
Tax History
| Year | Tax Paid | Tax Assessment Tax Assessment Total Assessment is a certain percentage of the fair market value that is determined by local assessors to be the total taxable value of land and additions on the property. | Land | Improvement |
|---|---|---|---|---|
| 2025 | $12,033 | $88,900 | $12,800 | $76,100 |
| 2024 | $11,735 | $88,900 | $12,800 | $76,100 |
| 2023 | $11,735 | $88,900 | $12,800 | $76,100 |
| 2022 | $11,020 | $88,900 | $12,800 | $76,100 |
| 2021 | $10,906 | $88,900 | $12,800 | $76,100 |
| 2020 | $9,978 | $84,100 | $12,800 | $71,300 |
| 2019 | $9,724 | $84,100 | $12,800 | $71,300 |
| 2018 | $9,469 | $84,100 | $12,800 | $71,300 |
| 2017 | $9,278 | $84,100 | $12,800 | $71,300 |
| 2016 | $9,190 | $84,100 | $12,800 | $71,300 |
| 2015 | $7,209 | $84,100 | $12,800 | $71,300 |
| 2014 | $7,038 | $84,100 | $12,800 | $71,300 |
Source: Public Records
Map
Nearby Homes