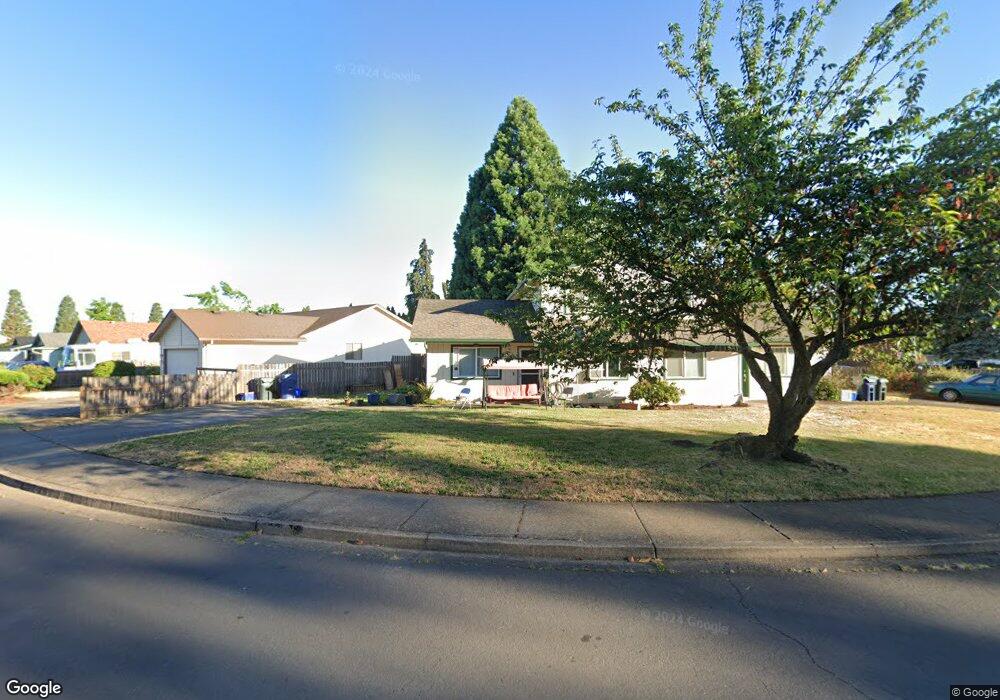
78 Shady Loop Springfield, OR 97477
North Springfield NeighborhoodEstimated Value: $404,981 - $461,000
6
Beds
2
Baths
2,124
Sq Ft
$204/Sq Ft
Est. Value
About This Home
This home is located at 78 Shady Loop, Springfield, OR 97477 and is currently estimated at $433,495, approximately $204 per square foot. 78 Shady Loop is a home located in Lane County with nearby schools including Elizabeth Page Elementary School, Hamlin Middle School, and Springfield High School.
Ownership History
Date
Name
Owned For
Owner Type
Purchase Details
Closed on
Aug 12, 2016
Sold by
St Vincent De Paul Society Of Lane Count
Bought by
Mainstream Housing Inc
Current Estimated Value
Home Financials for this Owner
Home Financials are based on the most recent Mortgage that was taken out on this home.
Original Mortgage
$100,000
Outstanding Balance
$9,723
Interest Rate
3.48%
Mortgage Type
Construction
Estimated Equity
$423,772
Create a Home Valuation Report for This Property
The Home Valuation Report is an in-depth analysis detailing your home's value as well as a comparison with similar homes in the area
Home Values in the Area
Average Home Value in this Area
Purchase History
| Date | Buyer | Sale Price | Title Company |
|---|---|---|---|
| Mainstream Housing Inc | $203,350 | Cascade Title Company |
Source: Public Records
Mortgage History
| Date | Status | Borrower | Loan Amount |
|---|---|---|---|
| Open | Mainstream Housing Inc | $100,000 |
Source: Public Records
Tax History Compared to Growth
Tax History
| Year | Tax Paid | Tax Assessment Tax Assessment Total Assessment is a certain percentage of the fair market value that is determined by local assessors to be the total taxable value of land and additions on the property. | Land | Improvement |
|---|---|---|---|---|
| 2025 | $3,837 | $209,251 | -- | -- |
| 2024 | $3,775 | $203,157 | -- | -- |
| 2023 | $3,775 | $197,240 | $0 | $0 |
| 2022 | $3,496 | $191,496 | $0 | $0 |
| 2021 | $0 | $219,814 | $0 | $0 |
| 2020 | $0 | $213,412 | $0 | $0 |
| 2019 | $0 | $207,197 | $0 | $0 |
| 2018 | $0 | $195,304 | $0 | $0 |
| 2017 | $0 | $195,304 | $0 | $0 |
| 2016 | -- | $189,616 | $0 | $0 |
| 2015 | -- | $184,093 | $0 | $0 |
| 2014 | -- | $178,731 | $0 | $0 |
Source: Public Records
Map
Nearby Homes
- 2240 5th St
- 236 Greenvale Dr
- 2150 Laura St Unit 119
- 2150 Laura St Unit 111
- 2150 Laura St Unit 39
- 2150 Laura St Unit 57
- 2150 Laura St Unit 83
- 2150 Laura St Unit 44
- 2150 Laura (#57) St Unit 57
- 212 Hayden Bridge Way
- 364 Scotts Glen Dr
- 114 Hayden Bridge Way
- 40 Allen Ave
- 1938 7th St
- 484 Scotts Glen Dr
- 485 Scotts Glen Dr
- 2567 Game Farm Rd
- 780 Q St
- 2268 9th St
- 937 S St