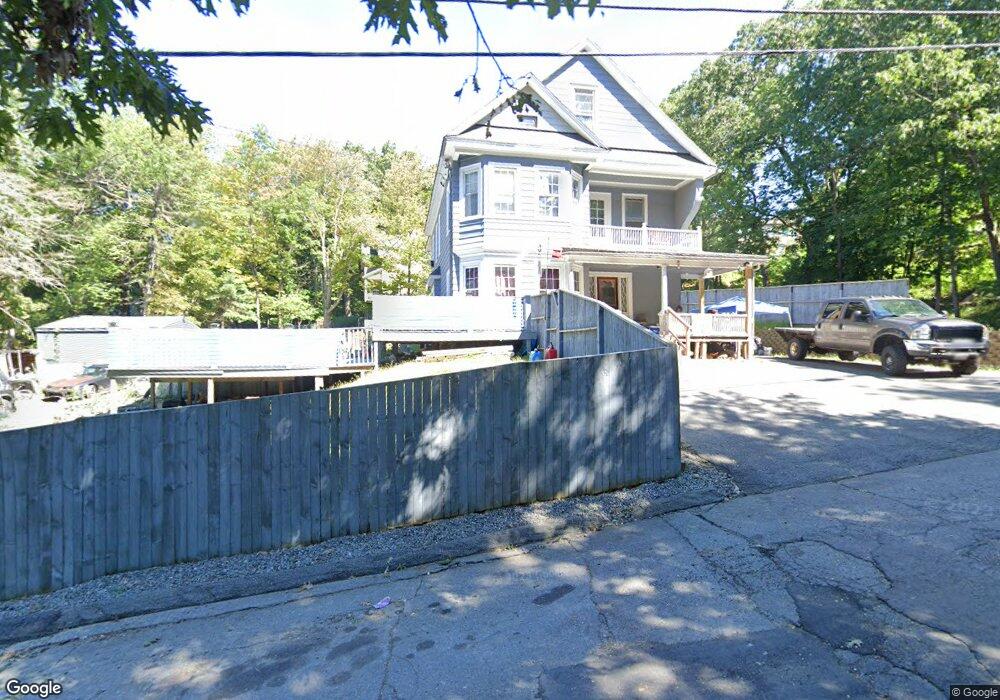
78 Simonds St Fitchburg, MA 01420
Estimated Value: $358,000 - $500,000
4
Beds
2
Baths
2,637
Sq Ft
$166/Sq Ft
Est. Value
About This Home
This home is located at 78 Simonds St, Fitchburg, MA 01420 and is currently estimated at $437,779, approximately $166 per square foot. 78 Simonds St is a home located in Worcester County with nearby schools including Crocker Elementary School, South Street Elementary School, and Fitchburg High School.
Ownership History
Date
Name
Owned For
Owner Type
Purchase Details
Closed on
Sep 28, 2016
Sold by
Lagos Michael G
Bought by
Lagos Matthew W
Current Estimated Value
Purchase Details
Closed on
Jul 12, 1996
Sold by
Babineau Kenneth J and Babineau Cynthia
Bought by
Lagos Michael G and Lagos Deloris
Home Financials for this Owner
Home Financials are based on the most recent Mortgage that was taken out on this home.
Original Mortgage
$91,718
Interest Rate
7.98%
Mortgage Type
Purchase Money Mortgage
Purchase Details
Closed on
Aug 31, 1990
Sold by
Shattuck Anne K
Bought by
Babineau Kennth J
Create a Home Valuation Report for This Property
The Home Valuation Report is an in-depth analysis detailing your home's value as well as a comparison with similar homes in the area
Home Values in the Area
Average Home Value in this Area
Purchase History
| Date | Buyer | Sale Price | Title Company |
|---|---|---|---|
| Lagos Matthew W | -- | -- | |
| Lagos Michael G | $92,000 | -- | |
| Babineau Kennth J | $106,000 | -- |
Source: Public Records
Mortgage History
| Date | Status | Borrower | Loan Amount |
|---|---|---|---|
| Previous Owner | Babineau Kennth J | $142,000 | |
| Previous Owner | Babineau Kennth J | $116,450 | |
| Previous Owner | Babineau Kennth J | $91,718 | |
| Previous Owner | Babineau Kennth J | $108,650 |
Source: Public Records
Tax History Compared to Growth
Tax History
| Year | Tax Paid | Tax Assessment Tax Assessment Total Assessment is a certain percentage of the fair market value that is determined by local assessors to be the total taxable value of land and additions on the property. | Land | Improvement |
|---|---|---|---|---|
| 2025 | $51 | $377,500 | $88,500 | $289,000 |
| 2024 | $5,215 | $352,100 | $55,800 | $296,300 |
| 2023 | $4,817 | $300,700 | $40,700 | $260,000 |
| 2022 | $4,397 | $249,700 | $35,700 | $214,000 |
| 2021 | $4,096 | $216,000 | $27,100 | $188,900 |
| 2020 | $3,847 | $195,200 | $22,200 | $173,000 |
| 2019 | $3,451 | $168,400 | $30,800 | $137,600 |
| 2018 | $852 | $147,800 | $28,400 | $119,400 |
| 2017 | $2,854 | $132,800 | $25,900 | $106,900 |
| 2016 | $2,749 | $129,500 | $25,900 | $103,600 |
| 2015 | $2,693 | $130,200 | $27,100 | $103,100 |
| 2014 | $2,582 | $130,200 | $27,100 | $103,100 |
Source: Public Records
Map
Nearby Homes