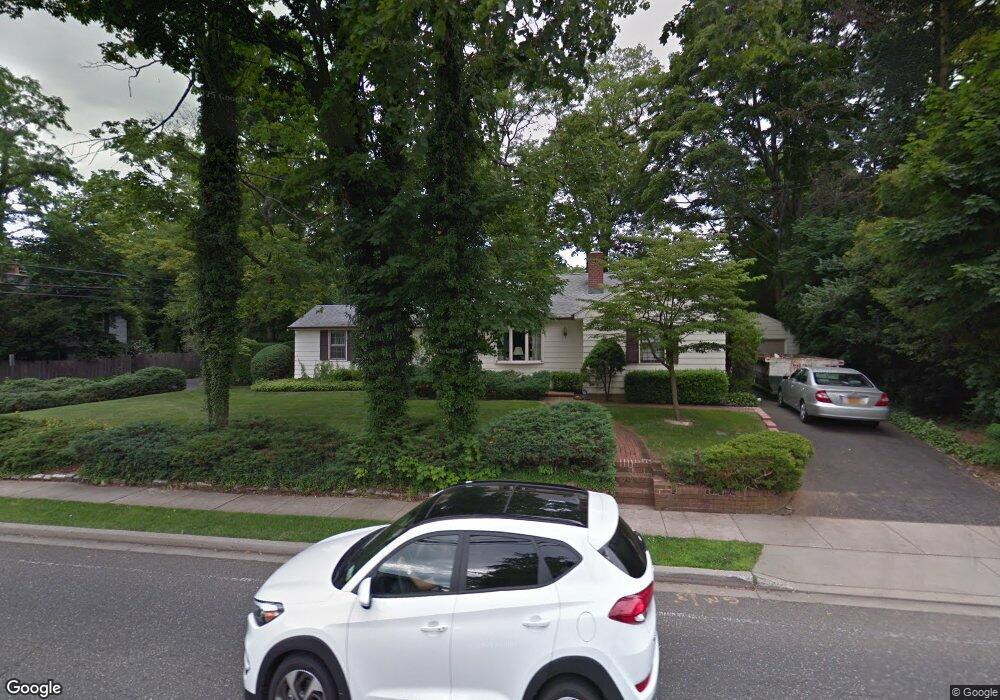
78 Split Rock Rd Syosset, NY 11791
Estimated Value: $875,000 - $939,382
4
Beds
2
Baths
1,556
Sq Ft
$583/Sq Ft
Est. Value
About This Home
This home is located at 78 Split Rock Rd, Syosset, NY 11791 and is currently estimated at $907,596, approximately $583 per square foot. 78 Split Rock Rd is a home located in Nassau County with nearby schools including Syosset Senior High School, St Edward Confessor School, and Our Lady of Mercy Academy.
Ownership History
Date
Name
Owned For
Owner Type
Purchase Details
Closed on
Feb 26, 2021
Sold by
Design Capital Llc
Bought by
Mollica Louis R
Current Estimated Value
Home Financials for this Owner
Home Financials are based on the most recent Mortgage that was taken out on this home.
Original Mortgage
$508,500
Outstanding Balance
$451,673
Interest Rate
2.7%
Mortgage Type
New Conventional
Estimated Equity
$455,923
Purchase Details
Closed on
Jan 8, 2018
Sold by
Zembruski Trust
Bought by
Design Capital Llc
Home Financials for this Owner
Home Financials are based on the most recent Mortgage that was taken out on this home.
Original Mortgage
$522,750
Interest Rate
4.7%
Mortgage Type
Commercial
Purchase Details
Closed on
Jan 21, 2016
Sold by
Zembruski Alice and Alice Zembruski Living Trust
Bought by
Alice Zembruski Irrevocable Trust
Purchase Details
Closed on
Jan 21, 2011
Sold by
Zembruski Alice D and Zembruski Edward T
Bought by
Zembruski Alice and Alice Zembruski Living Trust
Create a Home Valuation Report for This Property
The Home Valuation Report is an in-depth analysis detailing your home's value as well as a comparison with similar homes in the area
Home Values in the Area
Average Home Value in this Area
Purchase History
| Date | Buyer | Sale Price | Title Company |
|---|---|---|---|
| Mollica Louis R | $565,000 | Westcor Land Title | |
| Design Capital Llc | $615,000 | Commonwealth Land Title | |
| Alice Zembruski Irrevocable Trust | -- | Commonwealth Land Title Insu | |
| Zembruski Alice | -- | -- |
Source: Public Records
Mortgage History
| Date | Status | Borrower | Loan Amount |
|---|---|---|---|
| Open | Mollica Louis R | $508,500 | |
| Previous Owner | Design Capital Llc | $522,750 |
Source: Public Records
Tax History
| Year | Tax Paid | Tax Assessment Tax Assessment Total Assessment is a certain percentage of the fair market value that is determined by local assessors to be the total taxable value of land and additions on the property. | Land | Improvement |
|---|---|---|---|---|
| 2025 | $16,491 | $531 | $306 | $225 |
| 2024 | $4,288 | $546 | $315 | $231 |
| 2023 | $16,156 | $604 | $392 | $212 |
| 2022 | $16,156 | $570 | $329 | $241 |
| 2021 | $13,750 | $668 | $385 | $283 |
| 2020 | $17,682 | $819 | $796 | $23 |
| 2019 | $3,529 | $819 | $796 | $23 |
| 2018 | $8,392 | $819 | $0 | $0 |
| 2017 | $7,380 | $819 | $796 | $23 |
| 2016 | $10,689 | $819 | $703 | $116 |
| 2015 | $3,212 | $864 | $741 | $123 |
| 2014 | $3,212 | $864 | $741 | $123 |
| 2013 | $3,162 | $928 | $796 | $132 |
Source: Public Records
Map
Nearby Homes
- 74 Split Rock Rd
- 74 Split Rock Rd
- 75 Split Rock Rd
- 42 Church St
- 71 Split Rock Rd
- 67 Split Rock Rd
- 117 Split Rock Rd
- 70 Split Rock Rd
- 61 Berry Hill Rd
- 140 Split Rock Rd
- 140 Split Rock Rd
- 540 E Muttontown E
- 147 Roxton Rd
- . Lucille Dr
- 491 Muttontown Eastw Rd
- 4 Maryetta Ct
- 35 Maryetta Ct
- 65 Church St
- 135 Split Rock Rd
- 52 Church St
Your Personal Tour Guide
Ask me questions while you tour the home.