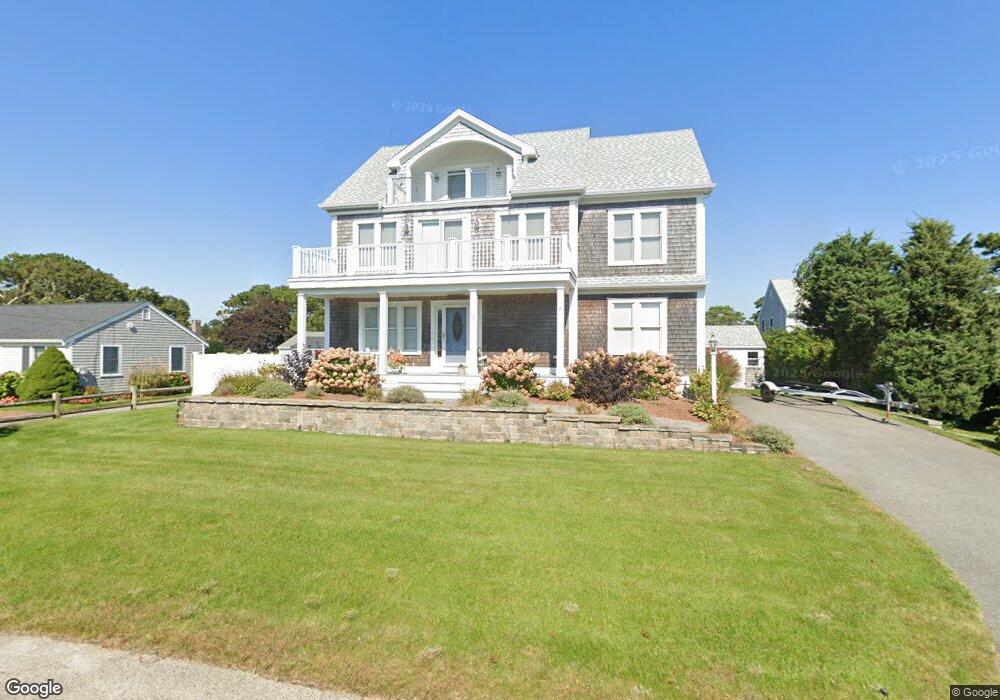
78 Surfside Rd West Dennis, MA 02670
West Dennis NeighborhoodEstimated Value: $1,104,000 - $1,899,000
2
Beds
1
Bath
1,001
Sq Ft
$1,564/Sq Ft
Est. Value
About This Home
This home is located at 78 Surfside Rd, West Dennis, MA 02670 and is currently estimated at $1,565,322, approximately $1,563 per square foot. 78 Surfside Rd is a home located in Barnstable County with nearby schools including Dennis-Yarmouth Regional High School and St. Pius X. School.
Ownership History
Date
Name
Owned For
Owner Type
Purchase Details
Closed on
Jun 22, 2021
Sold by
Weare Mark J and Weare Antonina
Bought by
Weare Ft and Weare
Current Estimated Value
Home Financials for this Owner
Home Financials are based on the most recent Mortgage that was taken out on this home.
Original Mortgage
$474,000
Outstanding Balance
$428,076
Interest Rate
2.88%
Mortgage Type
Adjustable Rate Mortgage/ARM
Estimated Equity
$1,137,246
Purchase Details
Closed on
Apr 29, 1998
Sold by
Calistro Josephine F
Bought by
Weare Mark J and Weare Antonina
Home Financials for this Owner
Home Financials are based on the most recent Mortgage that was taken out on this home.
Original Mortgage
$103,500
Interest Rate
7.04%
Mortgage Type
Purchase Money Mortgage
Create a Home Valuation Report for This Property
The Home Valuation Report is an in-depth analysis detailing your home's value as well as a comparison with similar homes in the area
Home Values in the Area
Average Home Value in this Area
Purchase History
| Date | Buyer | Sale Price | Title Company |
|---|---|---|---|
| Weare Ft | -- | None Available | |
| Weare Ft | -- | None Available | |
| Weare Mark J | $115,000 | -- | |
| Weare Mark J | $115,000 | -- |
Source: Public Records
Mortgage History
| Date | Status | Borrower | Loan Amount |
|---|---|---|---|
| Open | Weare Ft | $474,000 | |
| Closed | Weare Ft | $474,000 | |
| Previous Owner | Weare Mark J | $106,000 | |
| Previous Owner | Weare Mark J | $103,500 |
Source: Public Records
Tax History Compared to Growth
Tax History
| Year | Tax Paid | Tax Assessment Tax Assessment Total Assessment is a certain percentage of the fair market value that is determined by local assessors to be the total taxable value of land and additions on the property. | Land | Improvement |
|---|---|---|---|---|
| 2025 | $5,775 | $1,333,800 | $452,800 | $881,000 |
| 2024 | $6,010 | $1,369,100 | $435,500 | $933,600 |
| 2023 | $5,481 | $1,173,600 | $395,900 | $777,700 |
| 2022 | $5,255 | $938,400 | $356,600 | $581,800 |
| 2021 | $5,155 | $854,900 | $317,800 | $537,100 |
| 2020 | $5,508 | $903,000 | $317,800 | $585,200 |
| 2019 | $5,481 | $888,300 | $311,600 | $576,700 |
| 2018 | $5,078 | $800,900 | $296,600 | $504,300 |
| 2017 | $4,926 | $800,900 | $296,600 | $504,300 |
| 2016 | $3,703 | $567,100 | $326,300 | $240,800 |
| 2015 | $2,502 | $391,000 | $326,300 | $64,700 |
| 2014 | $2,606 | $410,400 | $326,300 | $84,100 |
Source: Public Records
Map
Nearby Homes
- 2 Rita Mary Way
- 178 School St
- 14 Schoolhouse Ln
- 209 Main St Unit 3
- 209 Main St Unit 6
- 209 Main St Unit 1
- 209 Main St Unit 2
- 209 Main St Unit 4
- 209 Main St Unit 5
- 23 Doric Ave
- 401 Main St Unit 201
- 401 Main St Unit 101
- 6 Baker Way
- 467 Main St
- 308 Old Main St
- 181 Pleasant St
- 428 Main St Unit 1-11
- 45 Seth Ln
- 61 Trotters Ln
- 40 Kelley Rd