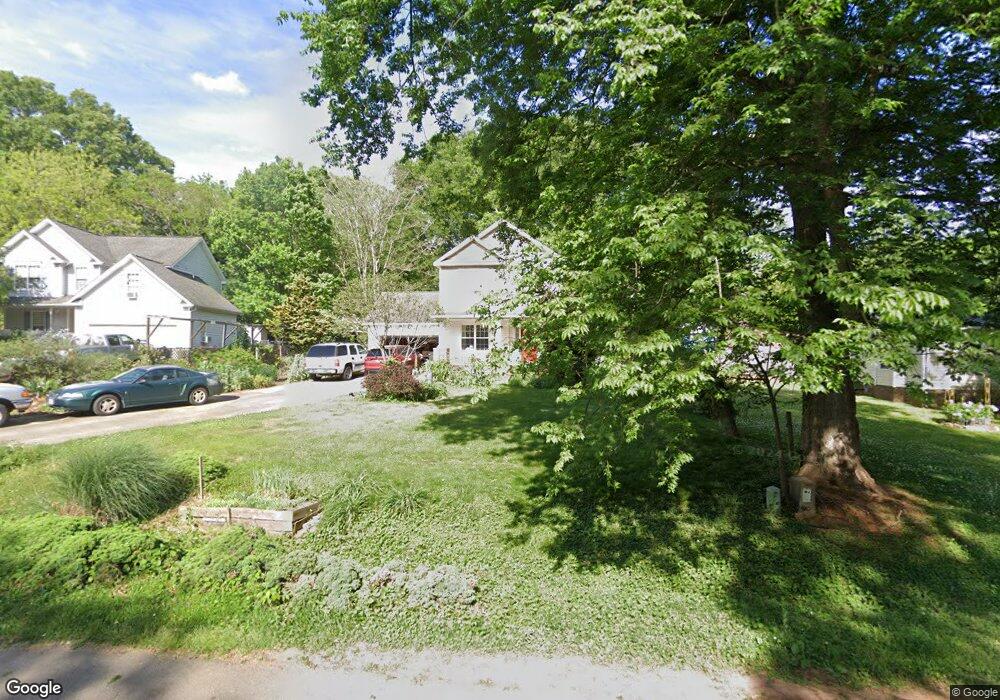
78 Thrift St Pittsboro, NC 27312
Estimated Value: $350,685 - $478,000
3
Beds
3
Baths
1,604
Sq Ft
$251/Sq Ft
Est. Value
About This Home
This home is located at 78 Thrift St, Pittsboro, NC 27312 and is currently estimated at $403,171, approximately $251 per square foot. 78 Thrift St is a home located in Chatham County with nearby schools including Pittsboro Elementary School, George Moses Horton Middle School, and Northwood High.
Ownership History
Date
Name
Owned For
Owner Type
Purchase Details
Closed on
Mar 14, 2008
Sold by
Holloman Joseph Brown and Holloman Millicent
Bought by
Hancock Samuel A
Current Estimated Value
Purchase Details
Closed on
May 16, 2003
Sold by
Byrd David Christopher
Bought by
Hancock Samuel A
Create a Home Valuation Report for This Property
The Home Valuation Report is an in-depth analysis detailing your home's value as well as a comparison with similar homes in the area
Home Values in the Area
Average Home Value in this Area
Purchase History
| Date | Buyer | Sale Price | Title Company |
|---|---|---|---|
| Hancock Samuel A | $40,000 | None Available | |
| Hancock Samuel A | $155,000 | -- |
Source: Public Records
Tax History Compared to Growth
Tax History
| Year | Tax Paid | Tax Assessment Tax Assessment Total Assessment is a certain percentage of the fair market value that is determined by local assessors to be the total taxable value of land and additions on the property. | Land | Improvement |
|---|---|---|---|---|
| 2025 | $3,944 | $338,575 | $51,320 | $287,255 |
| 2024 | $2,567 | $220,333 | $35,282 | $185,051 |
| 2023 | $2,479 | $220,333 | $35,282 | $185,051 |
| 2022 | $2,435 | $220,333 | $35,282 | $185,051 |
| 2021 | $2,227 | $220,333 | $35,282 | $185,051 |
| 2020 | $2,227 | $209,775 | $30,000 | $179,775 |
| 2019 | $2,499 | $209,775 | $30,000 | $179,775 |
| 2018 | $0 | $209,775 | $30,000 | $179,775 |
| 2017 | $2,392 | $209,775 | $30,000 | $179,775 |
| 2016 | $2,127 | $183,880 | $30,000 | $153,880 |
| 2015 | $2,105 | $183,880 | $30,000 | $153,880 |
| 2014 | -- | $183,880 | $30,000 | $153,880 |
| 2013 | -- | $183,880 | $30,000 | $153,880 |
Source: Public Records
Map
Nearby Homes
- 0 N Carolina 902
- 00 N Carolina 902
- 507 W Salisbury St
- 248 Ashford Dr
- 000 Alston Chapel Rd
- 162 Gaines Trail
- 425 Credle St
- 230 Oakwood Dr
- 116 Kensington Dr
- 298 E Salisbury St
- 66 Toomer Loop Rd
- 0 Nc 87 Hwy Unit 2491586
- 54 Pattishall Rd
- 15 Juniper Ct
- Tbd Versailles Ln
- 341 Windsong Dr
- 24 Cynthia Ln
- 726 Thompson St
- 344 May Farm Rd
- 74 Brookridge Ct