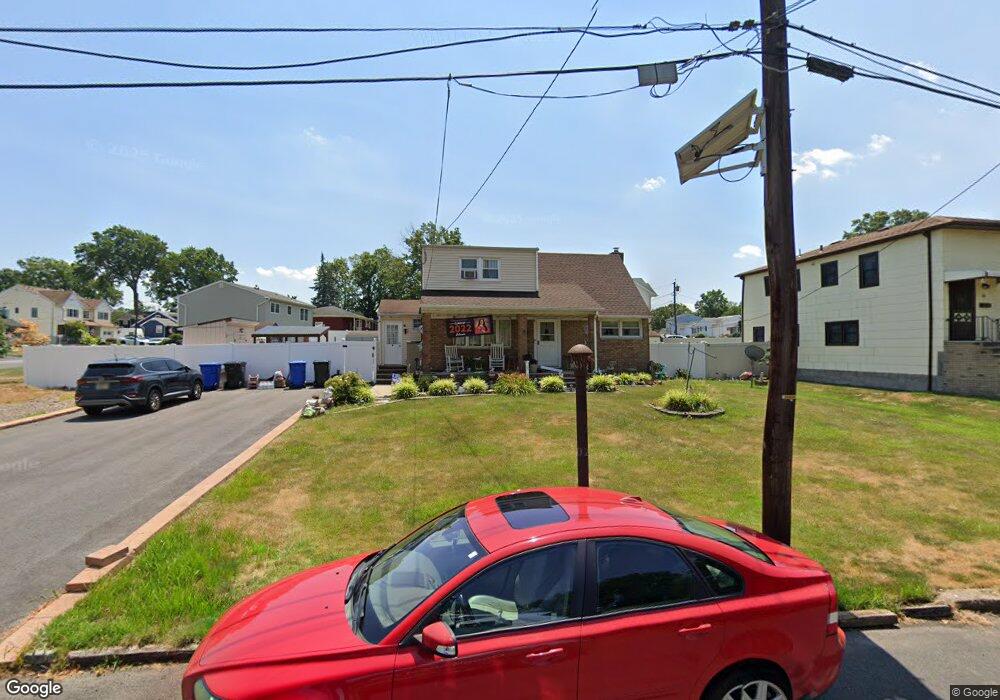
78 Vernon St Sewaren, NJ 07077
Estimated Value: $353,540 - $528,000
--
Bed
--
Bath
1,437
Sq Ft
$306/Sq Ft
Est. Value
About This Home
This home is located at 78 Vernon St, Sewaren, NJ 07077 and is currently estimated at $440,135, approximately $306 per square foot. 78 Vernon St is a home located in Middlesex County with nearby schools including Matthew Jago Elementary School, Avenel Middle School, and Woodbridge High School.
Ownership History
Date
Name
Owned For
Owner Type
Purchase Details
Closed on
Aug 20, 2002
Sold by
Sarmiento Antonio
Bought by
Marcelo Benito and Marcelo Mylene
Current Estimated Value
Home Financials for this Owner
Home Financials are based on the most recent Mortgage that was taken out on this home.
Original Mortgage
$174,943
Outstanding Balance
$72,437
Interest Rate
6.25%
Mortgage Type
FHA
Estimated Equity
$367,698
Purchase Details
Closed on
Jun 14, 1978
Bought by
Wyzykowski Dorothy
Create a Home Valuation Report for This Property
The Home Valuation Report is an in-depth analysis detailing your home's value as well as a comparison with similar homes in the area
Home Values in the Area
Average Home Value in this Area
Purchase History
| Date | Buyer | Sale Price | Title Company |
|---|---|---|---|
| Marcelo Benito | $178,705 | -- | |
| Wyzykowski Dorothy | $42,700 | -- |
Source: Public Records
Mortgage History
| Date | Status | Borrower | Loan Amount |
|---|---|---|---|
| Open | Marcelo Benito | $174,943 |
Source: Public Records
Tax History Compared to Growth
Tax History
| Year | Tax Paid | Tax Assessment Tax Assessment Total Assessment is a certain percentage of the fair market value that is determined by local assessors to be the total taxable value of land and additions on the property. | Land | Improvement |
|---|---|---|---|---|
| 2025 | $12,500 | $94,200 | $23,100 | $71,100 |
| 2024 | $12,184 | $94,200 | $23,100 | $71,100 |
| 2023 | $12,184 | $94,200 | $23,100 | $71,100 |
| 2022 | $11,427 | $94,200 | $23,100 | $71,100 |
| 2021 | $10,753 | $94,200 | $23,100 | $71,100 |
| 2020 | $10,926 | $94,200 | $23,100 | $71,100 |
| 2019 | $10,642 | $94,200 | $23,100 | $71,100 |
| 2018 | $10,356 | $94,200 | $23,100 | $71,100 |
| 2017 | $10,142 | $94,200 | $23,100 | $71,100 |
| 2016 | $10,293 | $94,200 | $23,100 | $71,100 |
| 2015 | $9,841 | $94,200 | $23,100 | $71,100 |
| 2014 | $9,600 | $94,200 | $23,100 | $71,100 |
Source: Public Records
Map
Nearby Homes