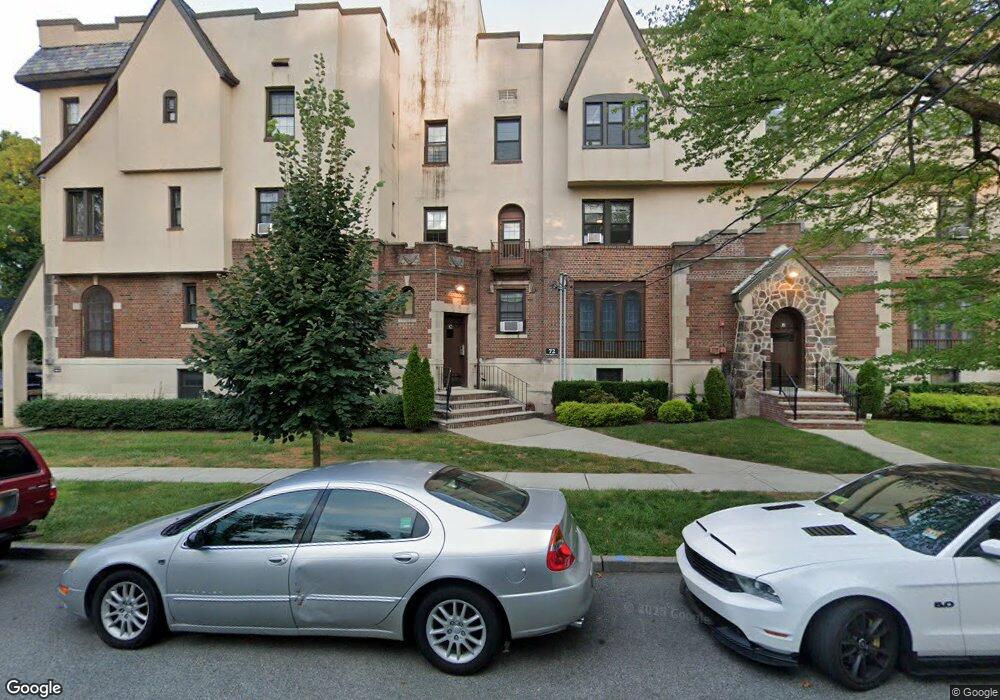
78 W Hudson Ave Unit C4 Englewood, NJ 07631
Estimated Value: $375,373 - $444,000
2
Beds
2
Baths
1,049
Sq Ft
$383/Sq Ft
Est. Value
About This Home
This home is located at 78 W Hudson Ave Unit C4, Englewood, NJ 07631 and is currently estimated at $401,593, approximately $382 per square foot. 78 W Hudson Ave Unit C4 is a home located in Bergen County with nearby schools including Dr Mccloud Elementary School, Dr J Grieco Elementary School, and J.E. Dismus Middle School.
Ownership History
Date
Name
Owned For
Owner Type
Purchase Details
Closed on
May 10, 2017
Sold by
Us Bank Na
Bought by
Huh Esther
Current Estimated Value
Home Financials for this Owner
Home Financials are based on the most recent Mortgage that was taken out on this home.
Original Mortgage
$181,200
Outstanding Balance
$150,358
Interest Rate
4.02%
Mortgage Type
New Conventional
Estimated Equity
$251,235
Purchase Details
Closed on
Nov 5, 2007
Sold by
George Peter and George Alison
Bought by
Kumar Sunil
Purchase Details
Closed on
Sep 6, 1994
Sold by
Fedl Natl Mtg Assoc
Bought by
George Peter
Home Financials for this Owner
Home Financials are based on the most recent Mortgage that was taken out on this home.
Original Mortgage
$77,000
Interest Rate
8.65%
Create a Home Valuation Report for This Property
The Home Valuation Report is an in-depth analysis detailing your home's value as well as a comparison with similar homes in the area
Home Values in the Area
Average Home Value in this Area
Purchase History
| Date | Buyer | Sale Price | Title Company |
|---|---|---|---|
| Huh Esther | $226,500 | Fidelity National Title Inc | |
| Kumar Sunil | $268,000 | -- | |
| George Peter | $86,000 | -- |
Source: Public Records
Mortgage History
| Date | Status | Borrower | Loan Amount |
|---|---|---|---|
| Open | Huh Esther | $181,200 | |
| Previous Owner | George Peter | $77,000 |
Source: Public Records
Tax History Compared to Growth
Tax History
| Year | Tax Paid | Tax Assessment Tax Assessment Total Assessment is a certain percentage of the fair market value that is determined by local assessors to be the total taxable value of land and additions on the property. | Land | Improvement |
|---|---|---|---|---|
| 2025 | $6,960 | $226,500 | $140,000 | $86,500 |
| 2024 | $6,750 | $226,500 | $140,000 | $86,500 |
| 2023 | $6,679 | $226,500 | $140,000 | $86,500 |
| 2022 | $6,679 | $226,500 | $140,000 | $86,500 |
| 2021 | $6,546 | $226,500 | $140,000 | $86,500 |
| 2020 | $6,376 | $226,500 | $140,000 | $86,500 |
| 2019 | $6,317 | $226,500 | $140,000 | $86,500 |
| 2018 | $6,653 | $244,400 | $140,000 | $104,400 |
| 2017 | $6,455 | $244,400 | $140,000 | $104,400 |
| 2016 | $6,249 | $244,400 | $140,000 | $104,400 |
| 2015 | $6,196 | $244,400 | $140,000 | $104,400 |
| 2014 | $6,144 | $244,400 | $140,000 | $104,400 |
Source: Public Records
Map
Nearby Homes
- 51 W Hudson Ave Unit 16
- 63 W Hudson Ave Unit C5
- 401 Conrad Rd
- 306 Tenafly Rd
- 325 Central Ave
- 48 Windsor Rd
- 43 Oak Ave
- 54 Oak Ave
- 82 S Roosevelt Square
- 58 Country Club Rd
- 300 Windsor Rd
- 254 Pindle Ave
- 46 Benjamin Rd
- 79 Slocum Ave
- 142 Slocum Ave
- 15 W Hamilton Ave
- 206 Central Ave
- 61 Glenwood Rd
- 190 Knickerbocker Rd Unit 17
- 162 Elm St
- 78 W Hudson Ave Unit B1
- 78 W Hudson Ave Unit A1
- 78 W Hudson Ave Unit A4
- 78 W Hudson Ave Unit A3
- 78 W Hudson Ave Unit C1
- 78 W Hudson Ave Unit C2
- 78 W Hudson Ave Unit B2
- 78 W Hudson Ave Unit A2
- 78 W Hudson Ave Unit A2
- 78 W Hudson Ave
- 430 Stockton Place
- 100 W Hudson Ave Unit A1
- 100 W Hudson Ave Unit D4
- 100 W Hudson Ave Unit E1
- 100 W Hudson Ave Unit B2
- 100 W Hudson Ave Unit D6
- 100 W Hudson Ave Unit F6
- 100 W Hudson Ave Unit F4
- 100 W Hudson Ave Unit F2
- 100 W Hudson Ave Unit F5