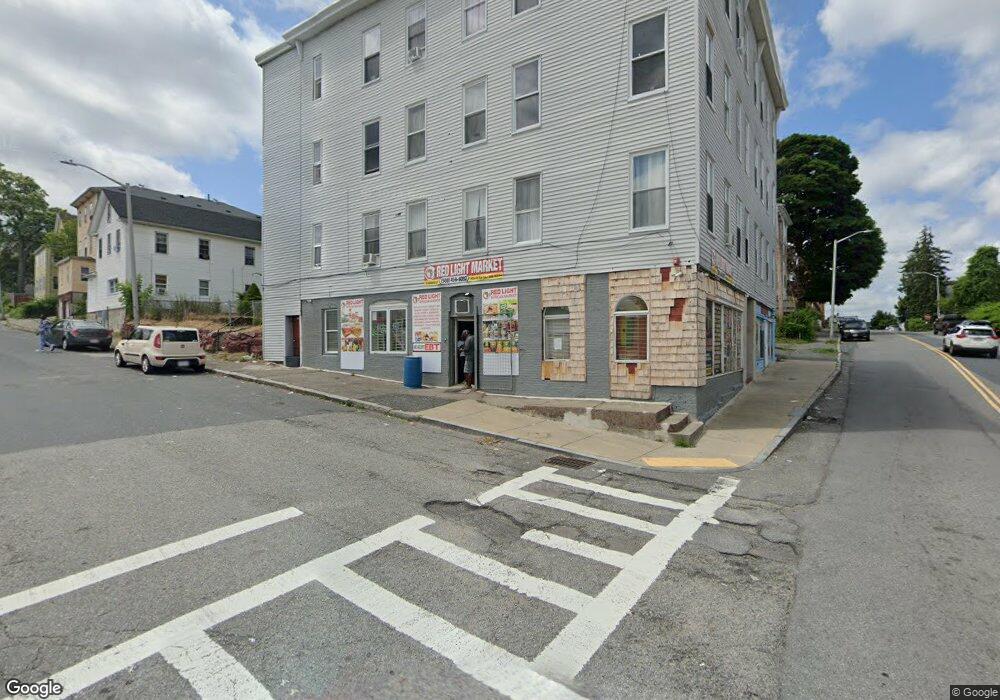
78 Waverly St Unit St. Worcester, MA 01604
Union HIll Neighborhood
6
Beds
8
Baths
10,368
Sq Ft
10,019
Sq Ft Lot
About This Home
This home is located at 78 Waverly St Unit St., Worcester, MA 01604. 78 Waverly St Unit St. is a home located in Worcester County with nearby schools including Jacob Hiatt Magnet School, Chandler Magnet, and Grafton Street.
Ownership History
Date
Name
Owned For
Owner Type
Purchase Details
Closed on
Aug 5, 2022
Sold by
Penn Waverly Worcester Rt
Bought by
Windsor Estate Hldg Llc
Home Financials for this Owner
Home Financials are based on the most recent Mortgage that was taken out on this home.
Original Mortgage
$4,250,000
Outstanding Balance
$4,056,338
Interest Rate
5.3%
Mortgage Type
Commercial
Purchase Details
Closed on
Aug 15, 2013
Sold by
Curtis Properties Llc
Bought by
Worcester Reo Svcs Llc
Purchase Details
Closed on
Oct 20, 2008
Sold by
Est Strzelecki Anele and Robillard Brian
Bought by
18 Penn Avenue Rt and Fiorillo Nicholas
Home Financials for this Owner
Home Financials are based on the most recent Mortgage that was taken out on this home.
Original Mortgage
$346,000
Interest Rate
6.41%
Mortgage Type
Commercial
Create a Home Valuation Report for This Property
The Home Valuation Report is an in-depth analysis detailing your home's value as well as a comparison with similar homes in the area
Home Values in the Area
Average Home Value in this Area
Purchase History
| Date | Buyer | Sale Price | Title Company |
|---|---|---|---|
| Windsor Estate Hldg Llc | -- | None Available | |
| Worcester Reo Svcs Llc | -- | -- | |
| 18 Penn Avenue Rt | $312,500 | -- |
Source: Public Records
Mortgage History
| Date | Status | Borrower | Loan Amount |
|---|---|---|---|
| Open | Windsor Estate Hldg Llc | $4,250,000 | |
| Previous Owner | 18 Penn Avenue Rt | $346,000 |
Source: Public Records
Tax History Compared to Growth
Tax History
| Year | Tax Paid | Tax Assessment Tax Assessment Total Assessment is a certain percentage of the fair market value that is determined by local assessors to be the total taxable value of land and additions on the property. | Land | Improvement |
|---|---|---|---|---|
| 2025 | -- | $955,800 | $134,200 | $821,600 |
| 2024 | -- | $836,500 | $134,200 | $702,300 |
| 2023 | $0 | $910,000 | $116,600 | $793,400 |
| 2022 | $0 | $726,000 | $93,400 | $632,600 |
| 2021 | $0 | $368,900 | $74,700 | $294,200 |
| 2020 | $6,739 | $344,300 | $47,100 | $297,200 |
| 2019 | $7,113 | $334,100 | $44,600 | $289,500 |
| 2018 | $0 | $335,500 | $44,600 | $290,900 |
| 2017 | -- | $335,500 | $44,600 | $290,900 |
| 2016 | -- | $316,300 | $36,400 | $279,900 |
| 2015 | -- | $316,300 | $36,400 | $279,900 |
| 2014 | -- | $316,300 | $36,400 | $279,900 |
Source: Public Records
Map
Nearby Homes