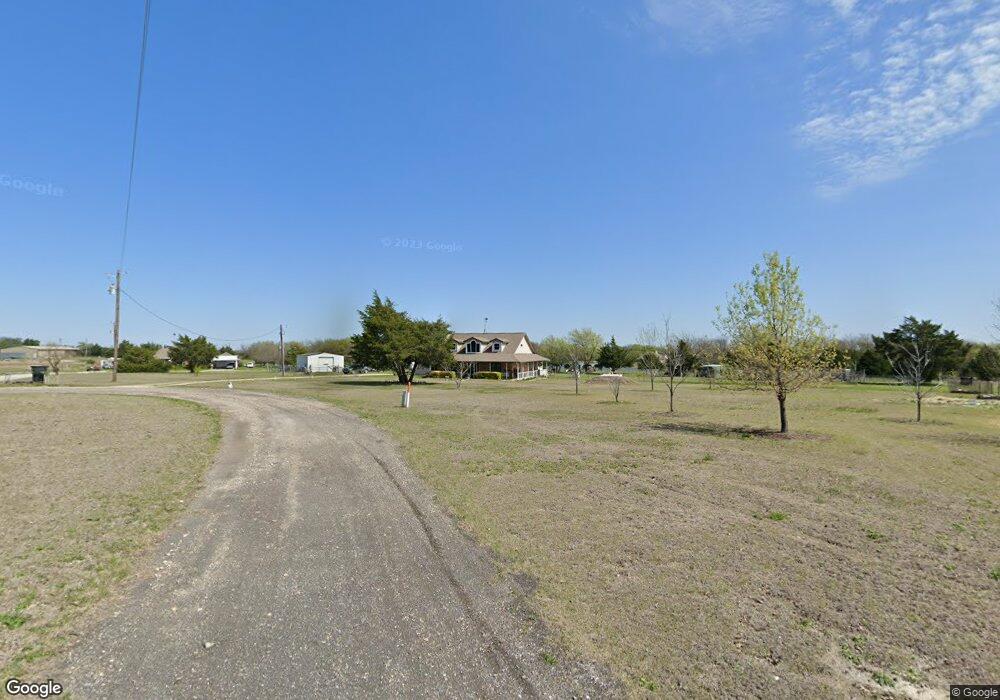
780 County Road 4444 Trenton, TX 75490
Estimated Value: $478,000 - $521,426
3
Beds
3
Baths
2,350
Sq Ft
$211/Sq Ft
Est. Value
About This Home
This home is located at 780 County Road 4444, Trenton, TX 75490 and is currently estimated at $495,142, approximately $210 per square foot. 780 County Road 4444 is a home located in Fannin County with nearby schools including Trenton Elementary School, Trenton Middle School, and Trenton High School.
Ownership History
Date
Name
Owned For
Owner Type
Purchase Details
Closed on
Jan 31, 2019
Sold by
Abounada Ibrahim
Bought by
Abounada Ibrahim and Abounada Elizabeth
Current Estimated Value
Purchase Details
Closed on
Dec 12, 2013
Sold by
Mccarley James H and Mccarley Christy L
Bought by
Abounada Ibrahim
Home Financials for this Owner
Home Financials are based on the most recent Mortgage that was taken out on this home.
Original Mortgage
$163,975
Outstanding Balance
$122,008
Interest Rate
4.25%
Mortgage Type
FHA
Estimated Equity
$373,134
Purchase Details
Closed on
Jan 2, 2006
Sold by
Dise Roger L and Theresa Dise V
Bought by
Alethes Llc
Home Financials for this Owner
Home Financials are based on the most recent Mortgage that was taken out on this home.
Original Mortgage
$141,135
Interest Rate
6.3%
Mortgage Type
Purchase Money Mortgage
Create a Home Valuation Report for This Property
The Home Valuation Report is an in-depth analysis detailing your home's value as well as a comparison with similar homes in the area
Home Values in the Area
Average Home Value in this Area
Purchase History
| Date | Buyer | Sale Price | Title Company |
|---|---|---|---|
| Abounada Ibrahim | -- | None Available | |
| Abounada Ibrahim | -- | Red Rivers Title Cpo | |
| Alethes Llc | -- | None Available |
Source: Public Records
Mortgage History
| Date | Status | Borrower | Loan Amount |
|---|---|---|---|
| Open | Abounada Ibrahim | $163,975 | |
| Previous Owner | Alethes Llc | $141,135 |
Source: Public Records
Tax History Compared to Growth
Tax History
| Year | Tax Paid | Tax Assessment Tax Assessment Total Assessment is a certain percentage of the fair market value that is determined by local assessors to be the total taxable value of land and additions on the property. | Land | Improvement |
|---|---|---|---|---|
| 2025 | $1,205 | $477,990 | $207,020 | $270,970 |
| 2024 | $1,205 | $453,960 | $177,470 | $276,490 |
| 2023 | $6,032 | $401,560 | $164,190 | $237,370 |
| 2022 | $5,153 | $346,600 | $121,370 | $225,230 |
| 2021 | $5,303 | $300,650 | $98,240 | $202,410 |
| 2020 | $5,278 | $284,170 | $72,930 | $211,240 |
| 2019 | $5,000 | $260,750 | $67,320 | $193,430 |
| 2018 | $4,636 | $226,250 | $53,290 | $172,960 |
| 2017 | $4,350 | $212,200 | $42,080 | $170,120 |
| 2016 | $4,169 | $203,380 | $38,150 | $165,230 |
| 2015 | -- | $196,760 | $33,660 | $163,100 |
| 2014 | -- | $170,000 | $33,660 | $136,340 |
Source: Public Records
Map
Nearby Homes
- 434 County Road 4445
- 432 County Road 4444
- LOT 1 County Rd 4534
- 10492 U S 69
- TBD N Highway 69
- TBD Lot 4 County Road 4535
- TBD Lot 2 County Road 4535
- TBD Lot 3 County Road 4535
- 549 Augustus St
- 513 Augustus St
- 211 Church St
- 304 Kelcey Ct
- 313 Kelcey Ct
- 301 Kelcey Ct
- 330 County Road 4545
- Lot 9 Kelcey Ct
- Lot 10 Kelcey Ct
- Lot 8 Kelcey Ct
- Lot 7 Kelcey Ct
- Lot 1 Kelcey Ct
- 760 County Road 4444
- 834 County Road 4444
- 753 County Road 4444
- 833 County Road 4444
- 684 County Road 4444
- 687 County Road 4444
- 650 County Road 4444
- 677 County Road 4444
- 401 County Road 4445
- 323 County Road 4445
- 295 County Road 4445
- 457 County Road 4445
- 577 Cr 4440
- 577 County Road 4440
- 1595 Fm 151
- 606 County Road 4444
- 547 County Road 4445
- 633 County Road 4444
- 530 County Road 4444
- 254 County Road 4445