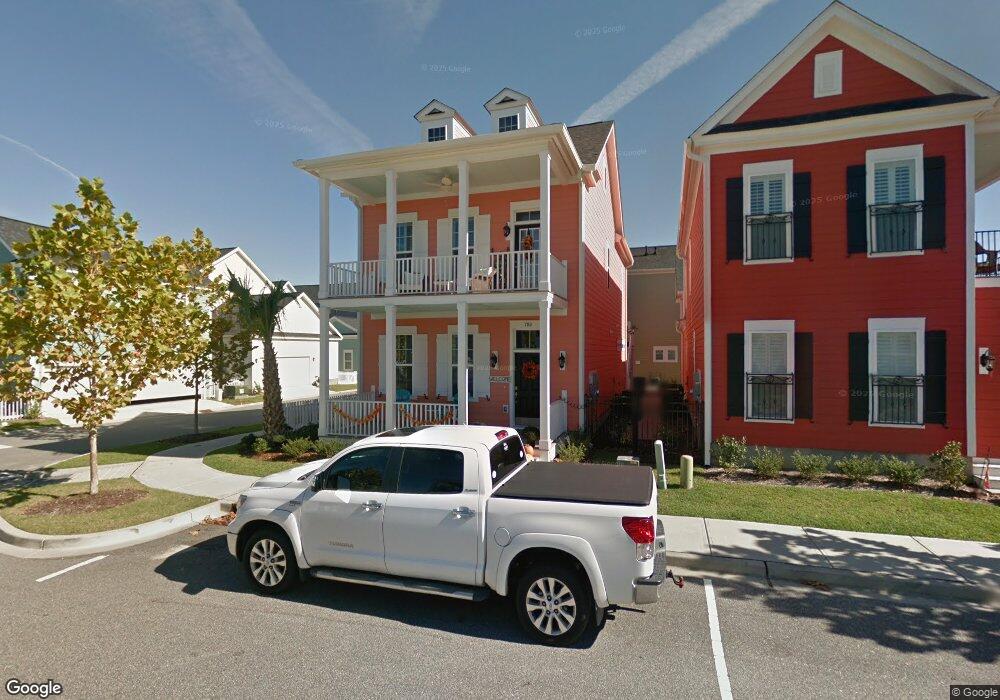
780 Johnson Ave Unit The Darlington Myrtle Beach, SC 29577
Market Commons NeighborhoodEstimated Value: $857,981 - $918,000
3
Beds
3
Baths
2,443
Sq Ft
$366/Sq Ft
Est. Value
About This Home
This home is located at 780 Johnson Ave Unit The Darlington, Myrtle Beach, SC 29577 and is currently estimated at $895,245, approximately $366 per square foot. 780 Johnson Ave Unit The Darlington is a home located in Horry County with nearby schools including Myrtle Beach Child Development Center, Myrtle Beach Primary School, and Myrtle Beach Elementary School.
Ownership History
Date
Name
Owned For
Owner Type
Purchase Details
Closed on
May 16, 2025
Sold by
Sharp Jason
Bought by
Garcia Juan and Garcia Delaine
Current Estimated Value
Purchase Details
Closed on
Nov 14, 2022
Sold by
Bazinga Llc
Bought by
Sharp Jason and Sharp Rebekah Zerbe
Home Financials for this Owner
Home Financials are based on the most recent Mortgage that was taken out on this home.
Original Mortgage
$598,410
Interest Rate
6.63%
Mortgage Type
New Conventional
Purchase Details
Closed on
Aug 31, 2021
Sold by
Mancini Mark
Bought by
Bazinga Llc
Purchase Details
Closed on
Oct 30, 2014
Sold by
Dockstreet At The Market Common Inc
Bought by
Mancini Mark
Home Financials for this Owner
Home Financials are based on the most recent Mortgage that was taken out on this home.
Original Mortgage
$280,067
Interest Rate
3.37%
Mortgage Type
Adjustable Rate Mortgage/ARM
Create a Home Valuation Report for This Property
The Home Valuation Report is an in-depth analysis detailing your home's value as well as a comparison with similar homes in the area
Home Values in the Area
Average Home Value in this Area
Purchase History
| Date | Buyer | Sale Price | Title Company |
|---|---|---|---|
| Garcia Juan | $905,000 | -- | |
| Sharp Jason | $664,900 | -- | |
| Bazinga Llc | -- | -- | |
| Mancini Mark | $350,084 | -- |
Source: Public Records
Mortgage History
| Date | Status | Borrower | Loan Amount |
|---|---|---|---|
| Previous Owner | Sharp Jason | $598,410 | |
| Previous Owner | Mancini Mark | $280,067 |
Source: Public Records
Tax History Compared to Growth
Tax History
| Year | Tax Paid | Tax Assessment Tax Assessment Total Assessment is a certain percentage of the fair market value that is determined by local assessors to be the total taxable value of land and additions on the property. | Land | Improvement |
|---|---|---|---|---|
| 2024 | $2,624 | $29,419 | $5,000 | $24,419 |
| 2023 | $2,624 | $23,775 | $4,529 | $19,246 |
| 2021 | $6,425 | $25,171 | $5,683 | $19,488 |
| 2020 | $6,128 | $25,171 | $5,683 | $19,488 |
| 2019 | $1,214 | $16,780 | $3,788 | $12,992 |
| 2018 | $1,083 | $13,782 | $2,598 | $11,184 |
| 2017 | $1,053 | $13,782 | $2,598 | $11,184 |
| 2016 | -- | $13,782 | $2,598 | $11,184 |
| 2015 | $5,374 | $13,783 | $2,599 | $11,184 |
| 2014 | -- | $1,600 | $1,600 | $0 |
Source: Public Records
Map
Nearby Homes
- 813 Pancho St
- 804 Shine Ave
- 800 Curtis Brown Ln
- 736 Satterwhite Way
- 718 Shine Ave
- 754 Murray Ave
- 3400 Pampas Dr
- 853 Johnson Ave
- 830 Howard Ave Unit D
- 3385 Pampas Dr
- 750 Howard Ave Unit E
- 2794 Howard Ave Unit A
- 927 Iris St
- 1411 Peterson St
- 3448 Baldwin Ln
- 3452 Baldwin Ln
- 852 Iris St Unit D
- 847 Iris St Unit A
- 981 Hackler St Unit D
- 2931 Howard Ave Unit C
- 780 Johnson Ave
- 774 Johnson Ave
- 2519 Kruzel St
- Lot 2 R10N Kruzel St Unit Lancaster
- Lot 5 R10N Kruzel St Unit The Dorchester
- Lot 25 R10N Kruzel St Unit The York
- Lot 3 R10N Kruzel St Unit The Verdier
- Lot 1 R10N Kruzel St Unit The Lyford
- Lot 24 R10N Kruzel St Unit The Olivia
- Lot # 4 R10 N Kruzel St Unit Lancaster
- Lot # 11 R9 N Kruzel St Unit Lyford
- Lot # 10 R9 N Kruzel St Unit Lancaster
- Lot # 7 R9 N Kruzel St Unit York
- Lot 6 R9N Kruzel St Unit The Verdier
- Lot 8 R9N Kruzel St Unit The Lyford
- Lot 13 R9N Kruzel St Unit The Lyford
- Lot # 12 R9 N Kruzel St Unit Lyford
- Lot 17 R9N Kruzel St Unit The York II
- Lot 9 R9N Kruzel St Unit Olivia
- Lot 16 R9N Kruzel St Unit Olivia