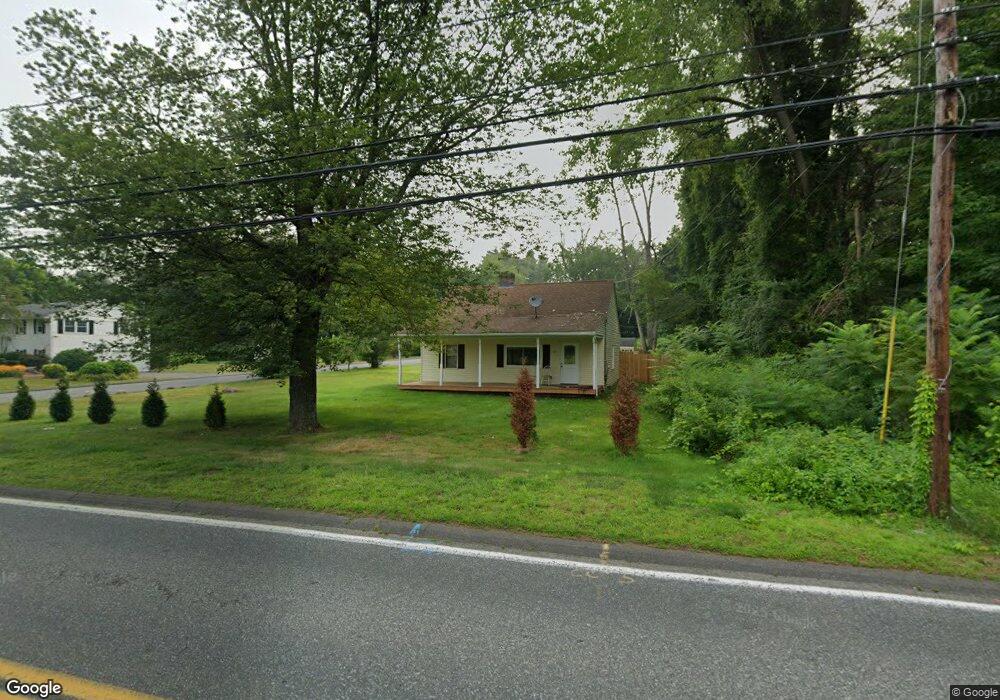
780 Main St Unit 1 Wilbraham, MA 01095
Estimated Value: $388,000 - $426,000
3
Beds
1
Bath
1,800
Sq Ft
$223/Sq Ft
Est. Value
About This Home
This home is located at 780 Main St Unit 1, Wilbraham, MA 01095 and is currently estimated at $401,333, approximately $222 per square foot. 780 Main St Unit 1 is a home located in Hampden County with nearby schools including Minnechaug Regional High School and Wilbraham & Monson Academy.
Ownership History
Date
Name
Owned For
Owner Type
Purchase Details
Closed on
Aug 6, 2010
Sold by
Fiore James W
Bought by
Fiore Darlene M and Fiore James W
Current Estimated Value
Purchase Details
Closed on
Jun 8, 2004
Sold by
Ameriquest Mtg Corp and Oneil Barry M
Bought by
Fiori James
Create a Home Valuation Report for This Property
The Home Valuation Report is an in-depth analysis detailing your home's value as well as a comparison with similar homes in the area
Home Values in the Area
Average Home Value in this Area
Purchase History
| Date | Buyer | Sale Price | Title Company |
|---|---|---|---|
| Fiore Darlene M | -- | -- | |
| Fiori James | $111,000 | -- |
Source: Public Records
Tax History
| Year | Tax Paid | Tax Assessment Tax Assessment Total Assessment is a certain percentage of the fair market value that is determined by local assessors to be the total taxable value of land and additions on the property. | Land | Improvement |
|---|---|---|---|---|
| 2025 | $5,577 | $311,900 | $90,100 | $221,800 |
| 2024 | $5,282 | $285,500 | $90,100 | $195,400 |
| 2023 | $49 | $275,500 | $90,100 | $185,400 |
| 2022 | $4,856 | $237,000 | $90,100 | $146,900 |
| 2021 | $4,826 | $210,200 | $95,300 | $114,900 |
| 2020 | $4,704 | $210,200 | $95,300 | $114,900 |
| 2019 | $4,582 | $210,200 | $95,300 | $114,900 |
| 2018 | $4,356 | $192,400 | $95,300 | $97,100 |
| 2017 | $4,233 | $192,400 | $95,300 | $97,100 |
| 2016 | $4,206 | $194,700 | $105,800 | $88,900 |
| 2015 | $4,065 | $194,700 | $105,800 | $88,900 |
Source: Public Records
Map
Nearby Homes
- 24 Mcintosh Dr
- 6 Katie St
- 230V Burleigh Rd
- 85 Baldwin Dr
- 6 Hilltop Park
- 107 Baldwin Dr
- 5 Edgewood Rd
- 8 Patriot Ridge Ln
- 1070 Glendale Rd
- 474 Mountain Rd
- 25 Angelica Dr
- 20 Old Orchard Rd
- 140 Slumber Ln
- 6 Brooklawn Rd
- 325 Allen St
- 46 Holland Dr
- 16 Deerfoot Dr
- 733 Monson Rd
- 745 Glendale Rd
- 0 Mountain Rd Unit 73267162
Your Personal Tour Guide
Ask me questions while you tour the home.