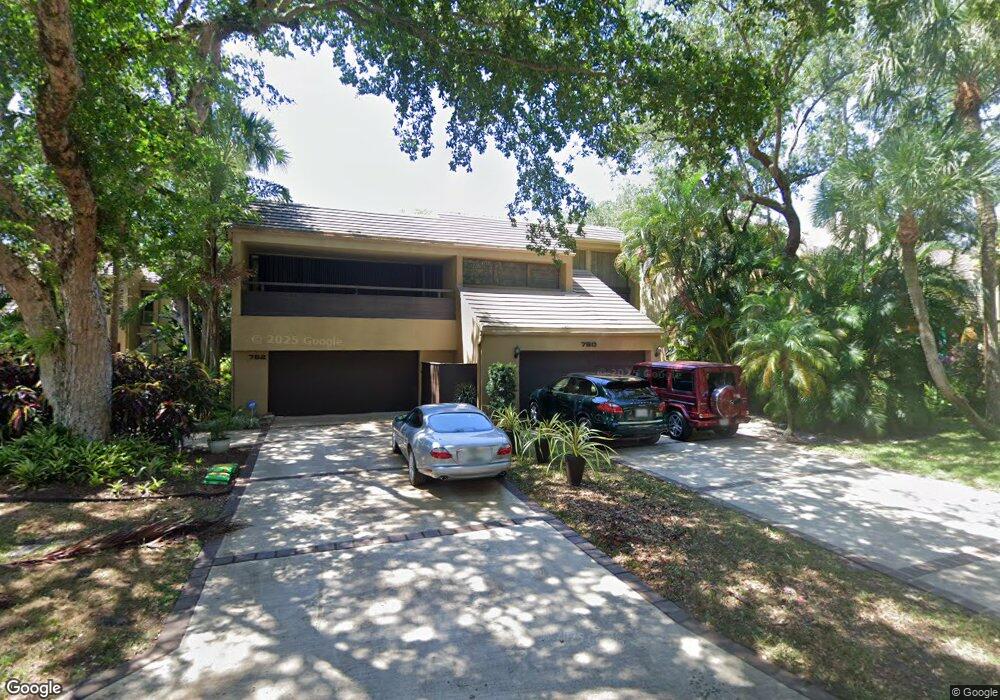
780 Saint Albans Dr Unit N/A Boca Raton, FL 33486
The Pinelands NeighborhoodEstimated Value: $597,000 - $755,000
3
Beds
3
Baths
2,278
Sq Ft
$294/Sq Ft
Est. Value
About This Home
This home is located at 780 Saint Albans Dr Unit N/A, Boca Raton, FL 33486 and is currently estimated at $669,136, approximately $293 per square foot. 780 Saint Albans Dr Unit N/A is a home located in Palm Beach County with nearby schools including J. C. Mitchell Elementary School, Boca Raton Community Middle School, and Boca Raton Community High School.
Ownership History
Date
Name
Owned For
Owner Type
Purchase Details
Closed on
Jan 17, 2024
Sold by
Mendyuk Irene
Bought by
Blue Bird Trust
Current Estimated Value
Purchase Details
Closed on
Nov 25, 2016
Sold by
Mendyuk Oleg
Bought by
Mendyuk Irene
Purchase Details
Closed on
Jan 6, 2016
Sold by
Uv Group Llc
Bought by
Mendyuk Irene
Home Financials for this Owner
Home Financials are based on the most recent Mortgage that was taken out on this home.
Original Mortgage
$300,000
Interest Rate
3.98%
Mortgage Type
New Conventional
Purchase Details
Closed on
Oct 23, 2014
Sold by
Hsbc Bank Usa National Association
Bought by
Uv Group Llc
Purchase Details
Closed on
Apr 8, 2014
Sold by
Homeowners Association Of Land S End Inc
Bought by
Hsbc Bank Usa National Association
Create a Home Valuation Report for This Property
The Home Valuation Report is an in-depth analysis detailing your home's value as well as a comparison with similar homes in the area
Home Values in the Area
Average Home Value in this Area
Purchase History
| Date | Buyer | Sale Price | Title Company |
|---|---|---|---|
| Blue Bird Trust | -- | None Listed On Document | |
| Mendyuk Irene | -- | Landsel Title Agency Inc | |
| Mendyuk Irene | $375,000 | Landsel Title Agency Inc | |
| Uv Group Llc | $255,000 | Premium Title Services Inc | |
| Hsbc Bank Usa National Association | $125,100 | None Available |
Source: Public Records
Mortgage History
| Date | Status | Borrower | Loan Amount |
|---|---|---|---|
| Previous Owner | Mendyuk Irene | $300,000 |
Source: Public Records
Tax History Compared to Growth
Tax History
| Year | Tax Paid | Tax Assessment Tax Assessment Total Assessment is a certain percentage of the fair market value that is determined by local assessors to be the total taxable value of land and additions on the property. | Land | Improvement |
|---|---|---|---|---|
| 2024 | $6,526 | $408,890 | -- | -- |
| 2023 | $6,374 | $396,981 | $0 | $0 |
| 2022 | $6,308 | $385,418 | $0 | $0 |
| 2021 | $6,267 | $374,192 | $0 | $374,192 |
| 2020 | $5,827 | $309,409 | $0 | $309,409 |
| 2019 | $6,077 | $313,915 | $0 | $313,915 |
| 2018 | $5,888 | $318,480 | $0 | $318,480 |
| 2017 | $5,970 | $318,480 | $0 | $0 |
| 2016 | $5,916 | $308,480 | $0 | $0 |
| 2015 | $6,196 | $313,480 | $0 | $0 |
| 2014 | -- | $243,480 | $0 | $0 |
Source: Public Records
Map
Nearby Homes
- 754 Saint Albans Dr
- 715 Saint Albans Dr
- 753 Saint Albans Dr
- 745 Saint Albans Dr
- 1400 NW 9th Ave Unit E33
- 825 NW 13th St Unit 115
- 825 NW 13th St Unit 1110
- 875 NW 13th St Unit 411
- 612 NW 13th St Unit 270
- 610 NW 13th St Unit 160
- 1050 NW 13th St Unit 285D
- 636 NW 13th St Unit 170
- 1061 NW 13th St Unit 2
- 1024 NW 13th St Unit 247B
- 642 NW 13th St Unit 310
- 640 NW 13th St Unit 260
- 1100 NW 13th St Unit 284D
- 861 NW 7th St
- 921 NW 7th St
- 460 NW 20th St Unit 1110
- 780 Saint Albans Dr Unit 780
- 780 Saint Albans Dr
- 782 Saint Albans Dr
- 782 St Albans Dr
- 784 Saint Albans Dr
- 776 Saint Albans Dr
- 774 Saint Albans Dr
- 786 Saint Albans Dr
- 772 Saint Albans Dr
- 772 St Albans Dr
- 793 Saint Albans Dr
- 791 Saint Albans Dr
- 770 Saint Albans Dr
- 788 Saint Albans Dr
- 789 Saint Albans Dr
- 787 Saint Albans Dr
- 758 Saint Albans Dr
- 7833 Saint Albans Dr
- 785 Saint Albans Dr
- 790 Saint Albans Dr