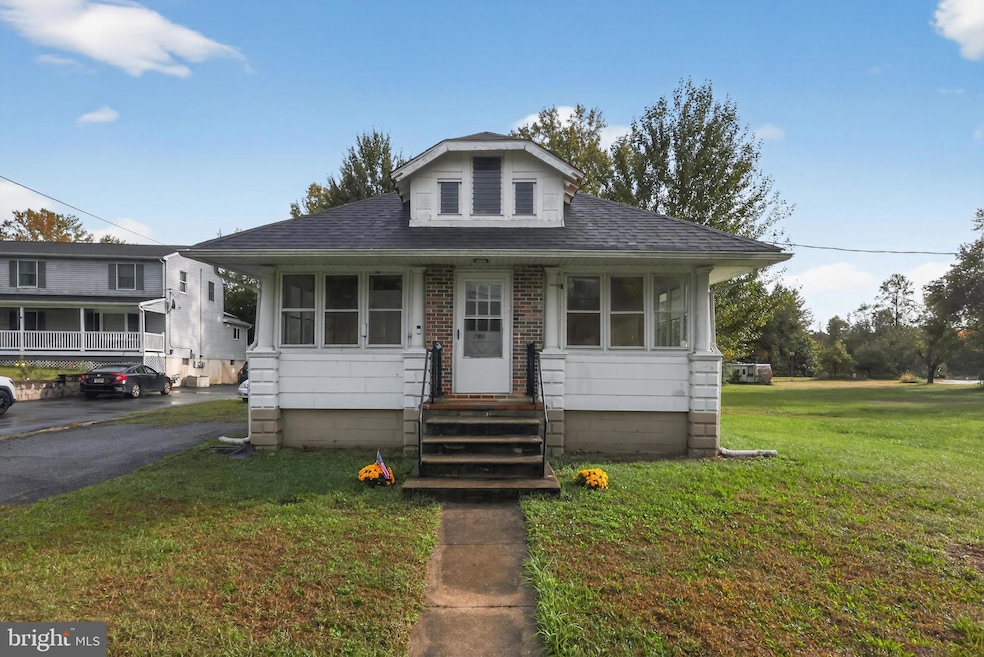

780 W Clayton Ave Clayton, NJ 08312
Estimated payment $1,486/month
Highlights
- Vaulted Ceiling
- Wood Flooring
- Attic
- Rambler Architecture
- Main Floor Bedroom
- No HOA
About This Home
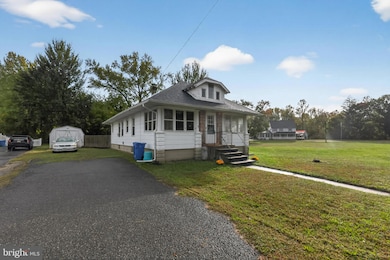
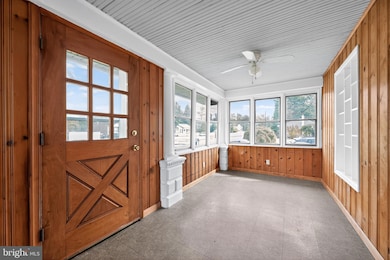
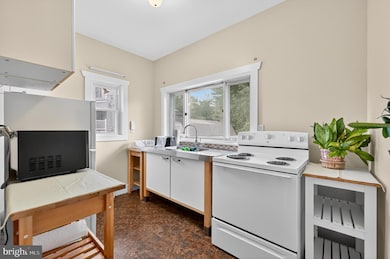
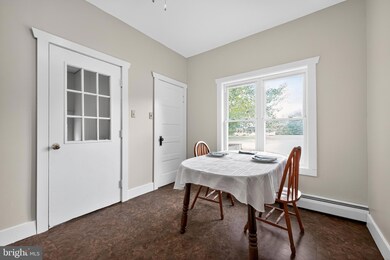
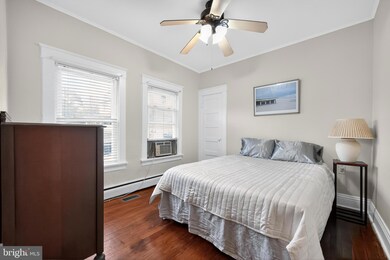
Charming bungalow in Clayton featuring 2 bedrooms, 1 bath, and beautiful hardwood floors throughout. The inviting enclosed front porch leads into a spacious living area with warm wood paneling and abundant natural light. Enjoy a bright dining room, a cozy kitchen, and a full unfinished basement with exposed beams for storage or future possibilities. A walk-up attic with vaulted ceilings adds even more potential. Set on a .17-acre lot, this home offers classic character and room to make it your own. Roof replaced 2023, furnace & water heater 2011, windows 2010, 150 amp service 2009, new sump pump 2024. Highest and Best offers due Monday 10/20/25 at 6pm
Home Details
Home Type
- Single Family
Est. Annual Taxes
- $4,865
Year Built
- Built in 1922
Lot Details
- 7,405 Sq Ft Lot
- Lot Dimensions are 55x135
- Wood Fence
- Level Lot
- Back, Front, and Side Yard
- Property is in average condition
- Property is zoned R-B
Parking
- 1 Car Detached Garage
- 4 Driveway Spaces
- Front Facing Garage
- Off-Street Parking
Home Design
- Rambler Architecture
- Bungalow
- Brick Exterior Construction
- Brick Foundation
- Shingle Roof
- Shingle Siding
Interior Spaces
- 960 Sq Ft Home
- Property has 1 Level
- Paneling
- Vaulted Ceiling
- Ceiling Fan
- Replacement Windows
- Living Room
- Dining Room
- Wood Flooring
- Attic
Kitchen
- Galley Kitchen
- Self-Cleaning Oven
Bedrooms and Bathrooms
- 2 Main Level Bedrooms
- 1 Full Bathroom
Unfinished Basement
- Basement Fills Entire Space Under The House
- Laundry in Basement
Accessible Home Design
- Level Entry For Accessibility
Outdoor Features
- Patio
- Exterior Lighting
- Porch
Schools
- Herma S. Simmons Elementary School
- Clayton Middle School
- Clayton High School
Utilities
- Forced Air Heating System
- Electric Water Heater
- Cable TV Available
Community Details
- No Home Owners Association
Listing and Financial Details
- Tax Lot 00001
- Assessor Parcel Number 01-00501-00001
Map
Home Values in the Area
Average Home Value in this Area
Tax History
| Year | Tax Paid | Tax Assessment Tax Assessment Total Assessment is a certain percentage of the fair market value that is determined by local assessors to be the total taxable value of land and additions on the property. | Land | Improvement |
|---|---|---|---|---|
| 2025 | $4,866 | $196,600 | $65,700 | $130,900 |
| 2024 | $4,449 | $196,600 | $65,700 | $130,900 |
| 2023 | $4,449 | $110,100 | $31,900 | $78,200 |
| 2022 | $4,401 | $110,100 | $31,900 | $78,200 |
| 2021 | $4,348 | $110,100 | $31,900 | $78,200 |
| 2020 | $4,357 | $110,100 | $31,900 | $78,200 |
| 2019 | $4,283 | $110,100 | $31,900 | $78,200 |
| 2018 | $4,222 | $110,100 | $31,900 | $78,200 |
| 2017 | $4,151 | $110,100 | $31,900 | $78,200 |
| 2016 | $4,107 | $110,100 | $31,900 | $78,200 |
| 2015 | $3,986 | $110,100 | $31,900 | $78,200 |
| 2014 | $3,847 | $110,100 | $31,900 | $78,200 |
Property History
| Date | Event | Price | List to Sale | Price per Sq Ft |
|---|---|---|---|---|
| 10/13/2025 10/13/25 | For Sale | $205,000 | -- | $214 / Sq Ft |
Purchase History
| Date | Type | Sale Price | Title Company |
|---|---|---|---|
| Deed | $28,000 | Mcdonough W Thomas | |
| Deed | $28,000 | None Listed On Document | |
| Deed | $55,000 | None Available | |
| Sheriffs Deed | -- | Independence Abstract & Titl | |
| Deed | $88,000 | Congress | |
| Deed | $69,000 | Homestead Title Agency |
Mortgage History
| Date | Status | Loan Amount | Loan Type |
|---|---|---|---|
| Previous Owner | $74,800 | Purchase Money Mortgage |
Source: Bright MLS
MLS Number: NJGL2065166
APN: 01-00501-0000-00001
Disclaimer: Certain information contained herein is derived from information provided by parties other than Homes.com. All information provided is deemed reliable, but is not guaranteed to be accurate and should be independently verified.
![]() The data relating to real estate for sale on this website appears in part through the BRIGHT Internet Data Exchange program, a voluntary cooperative exchange of property listing data between licensed real estate brokerage firms, and is provided by BRIGHT through a licensing agreement.
The data relating to real estate for sale on this website appears in part through the BRIGHT Internet Data Exchange program, a voluntary cooperative exchange of property listing data between licensed real estate brokerage firms, and is provided by BRIGHT through a licensing agreement.
Listing information is from various brokers who participate in the Bright MLS IDX program and not all listings may be visible on the site.
The property information being provided on or through the website is for the personal, non-commercial use of consumers and such information may not be used for any purpose other than to identify prospective properties consumers may be interested in purchasing.
Some properties which appear for sale on the website may no longer be available because they are for instance, under contract, sold or are no longer being offered for sale.
Property information displayed is deemed reliable but is not guaranteed.
Copyright 2025 Bright MLS, Inc.
- 760 W Clayton Ave
- 904 Pine Ave
- 26 Silver Lake Dr
- 238 W Center St
- 710 Webster Dr
- 211 Hollywood Ave
- 100 Aura Rd Unit 112
- 100 Aura Rd Unit 212
- 100 Aura Rd Unit 214
- 100 Aura Rd Unit 311
- 100 Aura Rd Unit 111
- 100 Aura Rd Unit 110
- 125 W Clayton Ave
- 131 W Clinton St
- 124 W Howard St
- 113 22nd Ave
- 100 Jerrys Ave
- 440 N Delsea Dr
- 320 E Clayton Ave
- 7 Hawthorn Way
