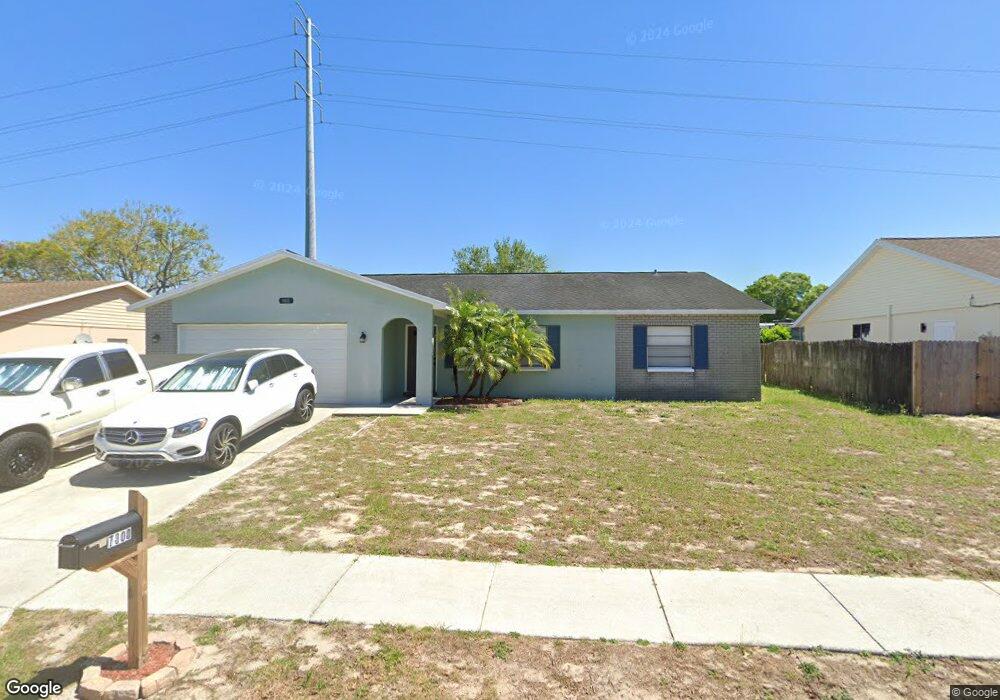
7800 Glascow Dr New Port Richey, FL 34653
Estimated Value: $293,422 - $355,000
--
Bed
2
Baths
1,739
Sq Ft
$186/Sq Ft
Est. Value
About This Home
This home is located at 7800 Glascow Dr, New Port Richey, FL 34653 and is currently estimated at $322,856, approximately $185 per square foot. 7800 Glascow Dr is a home located in Pasco County with nearby schools including Calusa Elementary School, Chasco Middle School, and Gulf High School.
Ownership History
Date
Name
Owned For
Owner Type
Purchase Details
Closed on
Apr 15, 2022
Sold by
Next Stage Properties Llc
Bought by
Resicap Florida Owner Ii Llc
Current Estimated Value
Purchase Details
Closed on
May 19, 2015
Sold by
Portzen Christopher
Bought by
Stage 2 Properties Llc
Purchase Details
Closed on
Mar 31, 2005
Sold by
Jackson Terrence and Demps Bernadette
Bought by
Portzen Christopher and Portzen Heather R
Home Financials for this Owner
Home Financials are based on the most recent Mortgage that was taken out on this home.
Original Mortgage
$122,320
Interest Rate
5.62%
Mortgage Type
Purchase Money Mortgage
Purchase Details
Closed on
Sep 1, 2000
Sold by
Davis Ted and Davis Shirley
Bought by
Demps Bernadette and Jackson Terrance
Home Financials for this Owner
Home Financials are based on the most recent Mortgage that was taken out on this home.
Original Mortgage
$8,000
Interest Rate
8.24%
Mortgage Type
Purchase Money Mortgage
Create a Home Valuation Report for This Property
The Home Valuation Report is an in-depth analysis detailing your home's value as well as a comparison with similar homes in the area
Home Values in the Area
Average Home Value in this Area
Purchase History
| Date | Buyer | Sale Price | Title Company |
|---|---|---|---|
| Resicap Florida Owner Ii Llc | $13,673,700 | Landcastle Title | |
| Stage 2 Properties Llc | $61,500 | None Available | |
| Portzen Christopher | $152,900 | Flagship Title Of Tampa Llp | |
| Demps Bernadette | $82,000 | -- |
Source: Public Records
Mortgage History
| Date | Status | Borrower | Loan Amount |
|---|---|---|---|
| Previous Owner | Portzen Christopher | $122,320 | |
| Previous Owner | Demps Bernadette | $8,000 | |
| Closed | Portzen Christopher | $30,580 |
Source: Public Records
Tax History Compared to Growth
Tax History
| Year | Tax Paid | Tax Assessment Tax Assessment Total Assessment is a certain percentage of the fair market value that is determined by local assessors to be the total taxable value of land and additions on the property. | Land | Improvement |
|---|---|---|---|---|
| 2025 | $4,740 | $267,499 | $41,220 | $226,279 |
| 2024 | $4,740 | $267,823 | $41,220 | $226,603 |
| 2023 | $4,708 | $267,495 | $37,500 | $229,995 |
| 2022 | $3,203 | $213,087 | $34,500 | $178,587 |
| 2021 | $2,814 | $166,538 | $30,959 | $135,579 |
| 2020 | $2,576 | $152,324 | $16,849 | $135,475 |
| 2019 | $2,358 | $135,883 | $18,949 | $116,934 |
| 2018 | $2,248 | $134,559 | $18,949 | $115,610 |
| 2017 | $2,094 | $121,928 | $17,749 | $104,179 |
| 2016 | $1,855 | $103,679 | $17,749 | $85,930 |
| 2015 | $1,689 | $91,806 | $17,749 | $74,057 |
| 2014 | $1,601 | $88,708 | $17,749 | $70,959 |
Source: Public Records
Map
Nearby Homes
- 7925 Foxwood Dr
- 7924 Royal Stewart Dr
- 7841 Royal Stewart Dr
- 7826 Kinross Dr
- 7518 Sequoia Dr
- 7807 Summertree Ln
- 7504 Sequoia Dr
- 7835 Crosier Ct
- 7449 Live Oak Ln
- 7525 Birdwood Ct
- 7624 Summertree Ln
- 8035 Cedar Creek Dr Unit 56
- 8122 Bull Run Dr
- 8128 Bull Run Dr
- 8105 Cedar Creek Dr
- 7706 Cherrytree Ln
- 8010 Buttonball Ln
- 8225 Arevee Dr Unit 819
- 8225 Arevee Dr Unit 334
- 8225 Arevee Dr Unit 363
- 7808 Glascow Dr
- 7748 Glascow Dr
- 7801 Mcpherson Dr
- 7816 Glascow Dr
- 7749 Mcpherson Dr
- 7809 Mcpherson Dr
- 7801 Glascow Dr
- 7809 Glascow Dr
- 7749 Glascow Dr
- 7817 Mcpherson Dr
- 7817 Glascow Dr
- 7824 Glascow Dr
- 8028 Cameron Cay Ct
- 8020 Cameron Cay Ct
- 7800 Osteen Rd
- 8046 Cameron Cay Ct
- 7808 Osteen Rd
- 8005 Cameron Cay Ct
- 7825 Glascow Dr
- 8012 Cameron Cay Ct