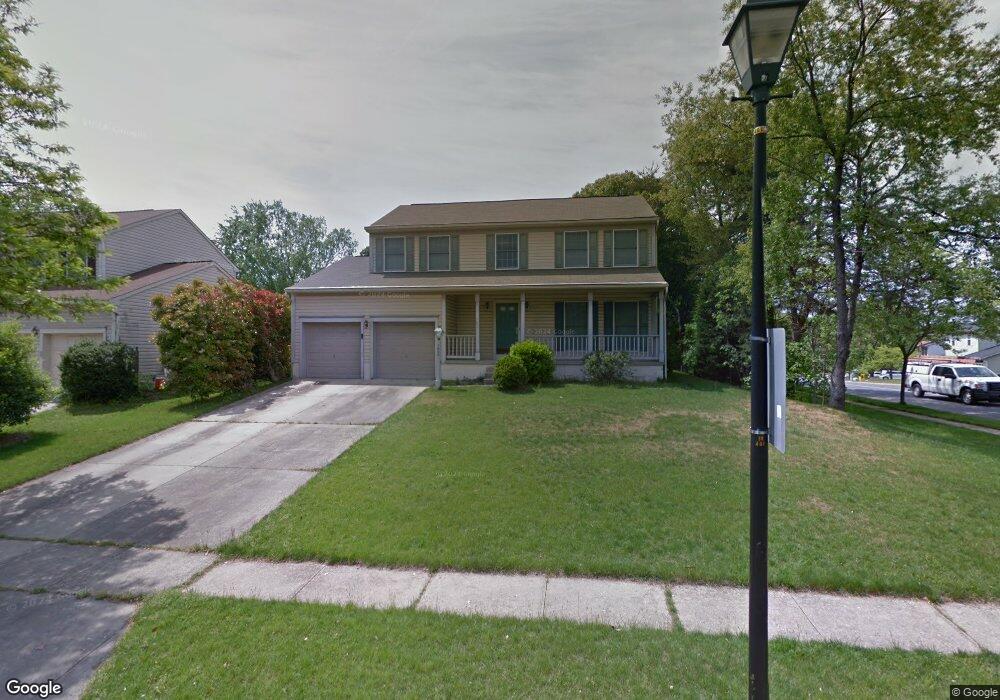
7800 Keenan Rd Glen Burnie, MD 21061
Estimated Value: $515,000 - $596,000
--
Bed
3
Baths
2,100
Sq Ft
$262/Sq Ft
Est. Value
About This Home
This home is located at 7800 Keenan Rd, Glen Burnie, MD 21061 and is currently estimated at $549,501, approximately $261 per square foot. 7800 Keenan Rd is a home located in Anne Arundel County with nearby schools including Quarterfield Elementary School, Corkran Middle School, and Glen Burnie High School.
Ownership History
Date
Name
Owned For
Owner Type
Purchase Details
Closed on
Jun 21, 2002
Sold by
Kondos Glen T
Bought by
Israelitt Jeffrey B
Current Estimated Value
Purchase Details
Closed on
Oct 8, 1993
Sold by
Parke West Dev Corp
Bought by
Kondos Glen T
Home Financials for this Owner
Home Financials are based on the most recent Mortgage that was taken out on this home.
Original Mortgage
$184,000
Interest Rate
6.9%
Purchase Details
Closed on
Aug 27, 1993
Sold by
Baldwin Entrprs Inc
Bought by
Parke West Dev Corp
Home Financials for this Owner
Home Financials are based on the most recent Mortgage that was taken out on this home.
Original Mortgage
$184,000
Interest Rate
6.9%
Purchase Details
Closed on
Nov 5, 1991
Sold by
Baldwin Enterprises Inc
Bought by
Parke West Development Corp
Home Financials for this Owner
Home Financials are based on the most recent Mortgage that was taken out on this home.
Original Mortgage
$800,000
Interest Rate
8.78%
Create a Home Valuation Report for This Property
The Home Valuation Report is an in-depth analysis detailing your home's value as well as a comparison with similar homes in the area
Home Values in the Area
Average Home Value in this Area
Purchase History
| Date | Buyer | Sale Price | Title Company |
|---|---|---|---|
| Israelitt Jeffrey B | $235,000 | -- | |
| Kondos Glen T | $184,495 | -- | |
| Parke West Dev Corp | $141,000 | -- | |
| Parke West Development Corp | $120,000 | -- |
Source: Public Records
Mortgage History
| Date | Status | Borrower | Loan Amount |
|---|---|---|---|
| Previous Owner | Parke West Dev Corp | $184,000 | |
| Previous Owner | Parke West Development Corp | $800,000 | |
| Closed | Israelitt Jeffrey B | -- | |
| Closed | Parke West Dev Corp | $0 |
Source: Public Records
Tax History Compared to Growth
Tax History
| Year | Tax Paid | Tax Assessment Tax Assessment Total Assessment is a certain percentage of the fair market value that is determined by local assessors to be the total taxable value of land and additions on the property. | Land | Improvement |
|---|---|---|---|---|
| 2025 | $3,598 | $409,100 | $167,700 | $241,400 |
| 2024 | $3,598 | $386,200 | $0 | $0 |
| 2023 | $3,484 | $363,300 | $0 | $0 |
| 2022 | $3,241 | $340,400 | $139,900 | $200,500 |
| 2021 | $6,381 | $337,933 | $0 | $0 |
| 2020 | $3,101 | $335,467 | $0 | $0 |
| 2019 | $3,055 | $333,000 | $119,900 | $213,100 |
| 2018 | $3,377 | $333,000 | $119,900 | $213,100 |
| 2017 | $2,895 | $333,000 | $0 | $0 |
| 2016 | -- | $347,200 | $0 | $0 |
| 2015 | -- | $330,600 | $0 | $0 |
| 2014 | -- | $314,000 | $0 | $0 |
Source: Public Records
Map
Nearby Homes
- 7805 Keenan Rd
- 235 Jenkins Way
- 227 Jenkins Way
- 204 Jenkins Way
- 7903 Covington Ave
- 528 Glen Ct
- 7917 Parke Dr W
- 714 Hyde Park Dr
- 521 Baylor Rd
- 516 Joy Cir
- 720 Hyde Park Dr
- 504 Elizabeth Rd
- 505 Baylor Rd
- 7715 Pecan Leaf Rd
- 7965 Quail Ct
- 7940 E Park Dr
- 479 Cedar Ln
- 7884 Walnut Grove Rd
- 352 Mae Rd
- 706 Mayo Rd
- 7802 Keenan Rd
- 0 Keenan Rd Unit 1008148328
- 0 Keenan Rd Unit 1008148302
- 0 Keenan Rd Unit 1008148244
- 0 Keenan Rd Unit 1008148216
- 0 Keenan Rd Unit 1008148208
- 0 Keenan Rd Unit AA9597571
- 0 Keenan Rd Unit AA9597566
- 0 Keenan Rd Unit AA9597559
- 0 Keenan Rd Unit AA9597553
- 0 Keenan Rd Unit AA9597550
- 626 Westphalia Dr
- 7801 Keenan Rd
- 627 Westphalia Ct
- 7808 Keenan Rd
- 625 Westphalia Dr Unit A
- 625 Westphalia Dr
- 625 Westphalia Dr Unit B
- 40 Private R W
- 7804 Keenan Rd