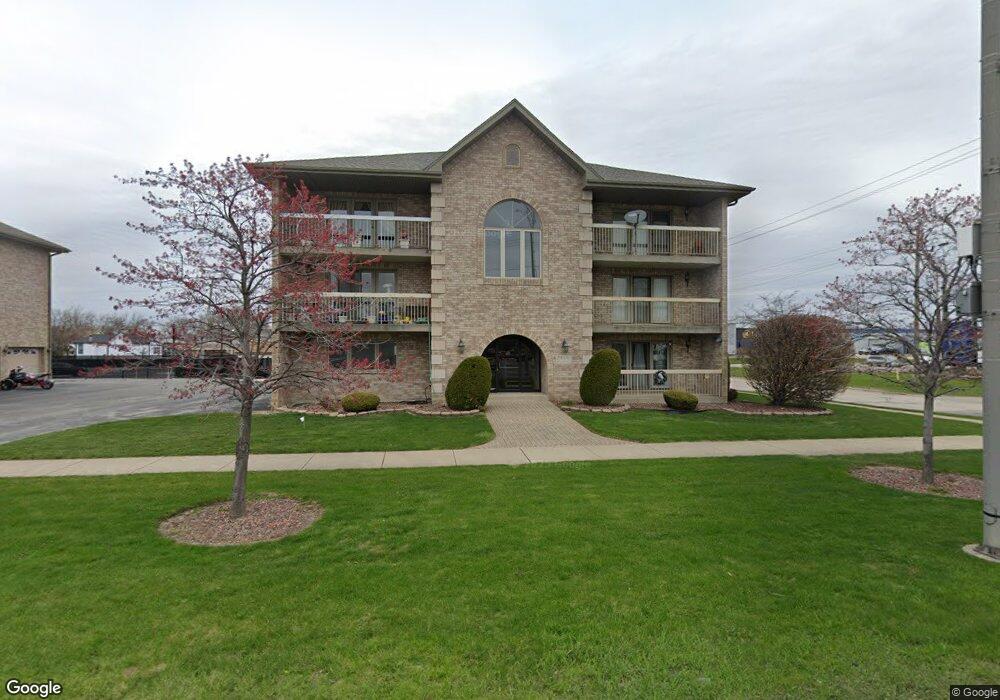
7800 W 79th St Unit 3W Bridgeview, IL 60455
Estimated Value: $191,000 - $225,000
2
Beds
2
Baths
9,120
Sq Ft
$22/Sq Ft
Est. Value
About This Home
This home is located at 7800 W 79th St Unit 3W, Bridgeview, IL 60455 and is currently estimated at $203,078, approximately $22 per square foot. 7800 W 79th St Unit 3W is a home located in Cook County with nearby schools including Robina Lyle Elementary and Argo Community High School.
Ownership History
Date
Name
Owned For
Owner Type
Purchase Details
Closed on
Feb 16, 2026
Sold by
Trust Number 21592 and First Midwest Bank
Bought by
Batroukh Hanan
Current Estimated Value
Purchase Details
Closed on
Nov 19, 2013
Sold by
Batroukh Nabil and Batroukh Ibrahim
Bought by
Standard Bank & Trust Company and Trust #21592
Purchase Details
Closed on
Dec 22, 2010
Sold by
Batroukh Mohammad
Bought by
Batroukh Nabil and Batroukh Ibrahim
Purchase Details
Closed on
Jun 28, 2000
Sold by
Younis Mohamed and Younis Rania
Bought by
Batroukh Mohammad
Home Financials for this Owner
Home Financials are based on the most recent Mortgage that was taken out on this home.
Original Mortgage
$108,500
Interest Rate
8.64%
Mortgage Type
Stand Alone First
Purchase Details
Closed on
Mar 24, 1999
Sold by
Bridgeview Bank & Trust
Bought by
Younis Mohamed and Younis Rania
Home Financials for this Owner
Home Financials are based on the most recent Mortgage that was taken out on this home.
Original Mortgage
$118,750
Interest Rate
6.89%
Create a Home Valuation Report for This Property
The Home Valuation Report is an in-depth analysis detailing your home's value as well as a comparison with similar homes in the area
Home Values in the Area
Average Home Value in this Area
Purchase History
| Date | Buyer | Sale Price | Title Company |
|---|---|---|---|
| Batroukh Hanan | -- | None Listed On Document | |
| Standard Bank & Trust Company | -- | None Available | |
| Batroukh Nabil | -- | None Available | |
| Batroukh Mohammad | $108,000 | -- | |
| Younis Mohamed | $125,000 | -- |
Source: Public Records
Mortgage History
| Date | Status | Borrower | Loan Amount |
|---|---|---|---|
| Previous Owner | Batroukh Mohammad | $108,500 | |
| Previous Owner | Younis Mohamed | $118,750 |
Source: Public Records
Tax History
| Year | Tax Paid | Tax Assessment Tax Assessment Total Assessment is a certain percentage of the fair market value that is determined by local assessors to be the total taxable value of land and additions on the property. | Land | Improvement |
|---|---|---|---|---|
| 2025 | $4,539 | $16,472 | $1,151 | $15,321 |
| 2024 | $4,539 | $16,472 | $1,151 | $15,321 |
| 2023 | $3,931 | $16,472 | $1,151 | $15,321 |
| 2022 | $3,931 | $13,255 | $1,023 | $12,232 |
| 2021 | $3,826 | $13,253 | $1,022 | $12,231 |
| 2020 | $3,790 | $13,253 | $1,022 | $12,231 |
| 2019 | $4,424 | $14,164 | $958 | $13,206 |
| 2018 | $4,225 | $14,164 | $958 | $13,206 |
| 2017 | $4,164 | $14,164 | $958 | $13,206 |
| 2016 | $3,394 | $10,786 | $831 | $9,955 |
| 2015 | $3,166 | $10,786 | $831 | $9,955 |
| 2014 | $2,393 | $10,786 | $831 | $9,955 |
| 2013 | $1,400 | $6,735 | $831 | $5,904 |
Source: Public Records
Map
Nearby Homes
- 7656 W 80th Place
- 7849 W 80th Place
- 7727 S Roberts Rd
- 7616 S 78th Ave
- 7722 W 81st Place
- 7549 Roberts Rd
- 7600 S Ferdinand Ave
- 7806 W 83rd St
- 7700 W 83rd St
- 7712 S Oketo Ave
- 7506 S Ferdinand Ave
- 7945 S Oketo Ave Unit 404
- 7945 S Oketo Ave Unit 408
- 7545 Beloit Ave
- 8307 S 77th Ct
- 8101 S Oketo Ave
- 8332 S 78th Ct
- 7749 Odell Ave
- 7929 W 74th St
- 7948 74th St
- 7800 W 79th St Unit 2E
- 7800 W 79th St Unit 1E
- 7800 W 79th St Unit 3E
- 7800 W 79th St Unit 2W
- 7800 W 79th St
- 7212 S 78th Ave
- 7836 S 78th Ave
- 7812 W 79th St Unit 1W
- 7812 W 79th St Unit 2E
- 7812 W 79th St Unit 2W
- 7812 W 79th St Unit 3E
- 7812 W 79th St Unit 3W
- 7832 S 78th Ave
- 7828 S 78th Ave
- 7833 S 78th Ct
- 7825 S 78th Ct
- 7814 S 78th Ave
- 7819 S 78th Ct
- 7812 S 78th Ave
Your Personal Tour Guide
Ask me questions while you tour the home.