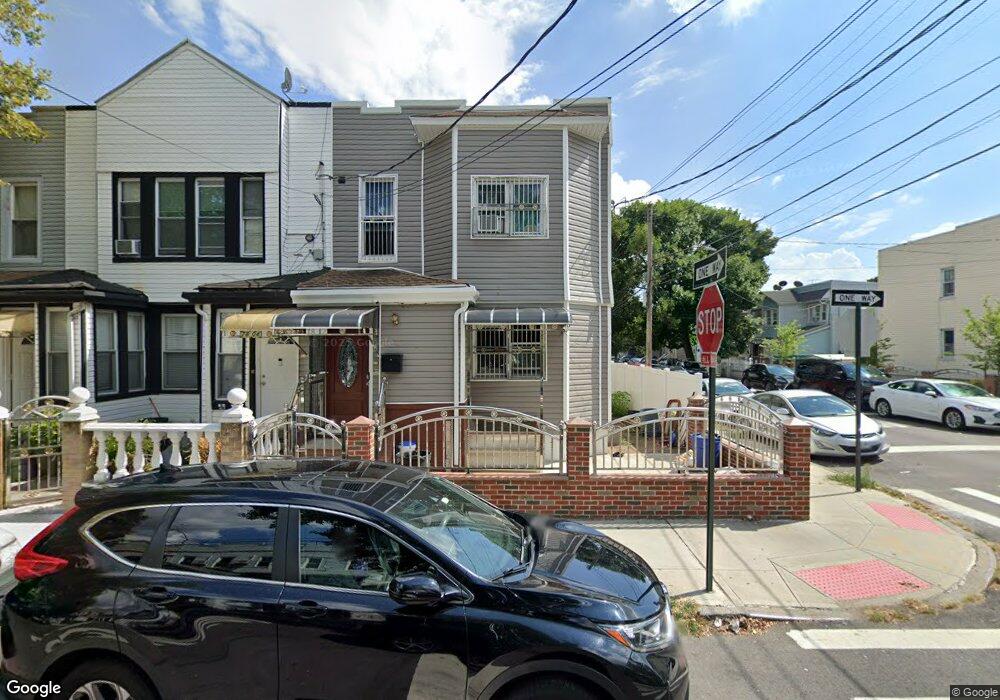
7802 95th Ave Ozone Park, NY 11416
Ozone Park NeighborhoodEstimated Value: $850,577 - $982,000
--
Bed
--
Bath
2,216
Sq Ft
$417/Sq Ft
Est. Value
About This Home
This home is located at 7802 95th Ave, Ozone Park, NY 11416 and is currently estimated at $923,144, approximately $416 per square foot. 7802 95th Ave is a home located in Queens County with nearby schools including P.S. 64 - Joseph P. Addabbo, Jhs 210 Elizabeth Blackwell, and Cypress Hills Ascend Charter Lower School.
Ownership History
Date
Name
Owned For
Owner Type
Purchase Details
Closed on
Nov 7, 2013
Sold by
Lomonaco Ann Marie
Bought by
Uddin Mohammed J
Current Estimated Value
Home Financials for this Owner
Home Financials are based on the most recent Mortgage that was taken out on this home.
Original Mortgage
$434,981
Outstanding Balance
$325,158
Interest Rate
4.29%
Mortgage Type
New Conventional
Estimated Equity
$597,986
Purchase Details
Closed on
Jan 11, 2011
Sold by
Lomonaco Deceased Peter
Bought by
Lomonaco Ann Marie
Create a Home Valuation Report for This Property
The Home Valuation Report is an in-depth analysis detailing your home's value as well as a comparison with similar homes in the area
Home Values in the Area
Average Home Value in this Area
Purchase History
| Date | Buyer | Sale Price | Title Company |
|---|---|---|---|
| Uddin Mohammed J | $475,000 | -- | |
| Lomonaco Ann Marie | -- | -- |
Source: Public Records
Mortgage History
| Date | Status | Borrower | Loan Amount |
|---|---|---|---|
| Open | Uddin Mohammed J | $434,981 |
Source: Public Records
Tax History Compared to Growth
Tax History
| Year | Tax Paid | Tax Assessment Tax Assessment Total Assessment is a certain percentage of the fair market value that is determined by local assessors to be the total taxable value of land and additions on the property. | Land | Improvement |
|---|---|---|---|---|
| 2025 | $7,876 | $41,566 | $12,953 | $28,613 |
| 2024 | $7,876 | $39,214 | $12,102 | $27,112 |
| 2023 | $7,513 | $37,404 | $11,681 | $25,723 |
| 2022 | $7,124 | $50,820 | $17,220 | $33,600 |
| 2021 | $7,400 | $51,360 | $17,220 | $34,140 |
| 2020 | $7,332 | $48,060 | $17,220 | $30,840 |
| 2019 | $6,836 | $48,240 | $17,220 | $31,020 |
| 2018 | $6,354 | $31,170 | $13,273 | $17,897 |
| 2017 | $6,062 | $29,738 | $15,923 | $13,815 |
| 2016 | $5,858 | $29,738 | $15,923 | $13,815 |
| 2015 | $3,384 | $28,865 | $18,602 | $10,263 |
| 2014 | $3,384 | $27,232 | $17,948 | $9,284 |
Source: Public Records
Map
Nearby Homes