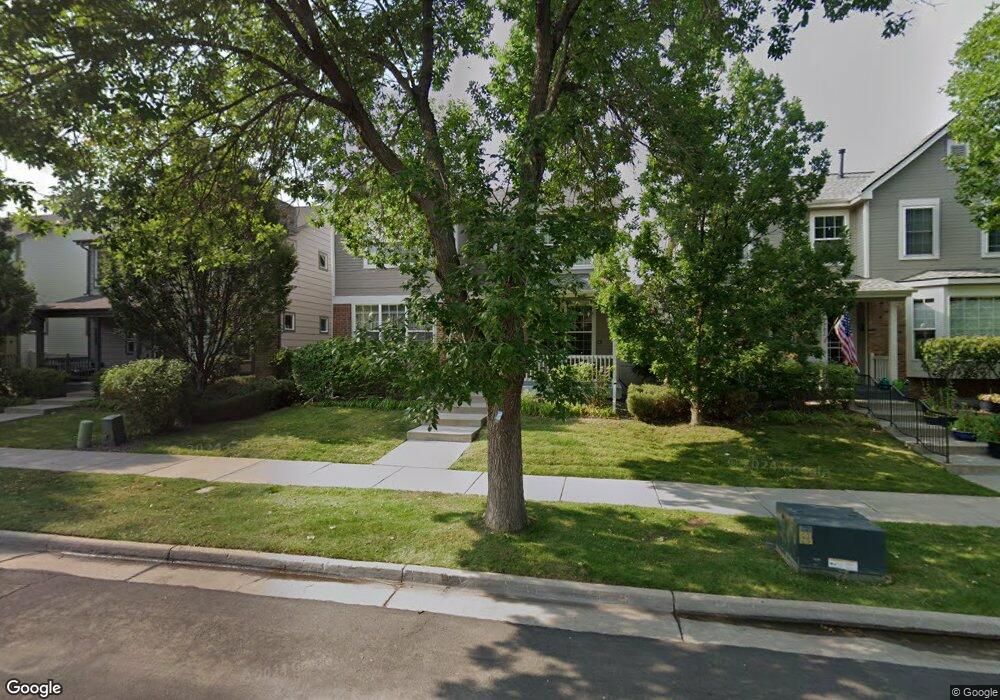
7802 E Archer Place Denver, CO 80230
Lowry NeighborhoodEstimated Value: $637,354 - $849,000
3
Beds
3
Baths
1,836
Sq Ft
$412/Sq Ft
Est. Value
About This Home
This home is located at 7802 E Archer Place, Denver, CO 80230 and is currently estimated at $756,339, approximately $411 per square foot. 7802 E Archer Place is a home located in Denver County with nearby schools including Lowry Elementary School, Hill Campus of Arts & Sciences, and George Washington High School.
Ownership History
Date
Name
Owned For
Owner Type
Purchase Details
Closed on
Jul 1, 2001
Sold by
Degena Haile
Bought by
Degena Haile and Kidane Hewot
Current Estimated Value
Home Financials for this Owner
Home Financials are based on the most recent Mortgage that was taken out on this home.
Original Mortgage
$259,920
Outstanding Balance
$95,281
Interest Rate
7.11%
Estimated Equity
$661,058
Purchase Details
Closed on
Jun 25, 2001
Sold by
Lang Andrew B
Bought by
Degena Haile
Home Financials for this Owner
Home Financials are based on the most recent Mortgage that was taken out on this home.
Original Mortgage
$259,920
Outstanding Balance
$95,281
Interest Rate
7.11%
Estimated Equity
$661,058
Purchase Details
Closed on
Mar 11, 1999
Sold by
Village Homes Of Colorado Inc
Bought by
Lang Andrew B and Lang Victoria A
Home Financials for this Owner
Home Financials are based on the most recent Mortgage that was taken out on this home.
Original Mortgage
$200,535
Interest Rate
6.73%
Create a Home Valuation Report for This Property
The Home Valuation Report is an in-depth analysis detailing your home's value as well as a comparison with similar homes in the area
Home Values in the Area
Average Home Value in this Area
Purchase History
| Date | Buyer | Sale Price | Title Company |
|---|---|---|---|
| Degena Haile | -- | -- | |
| Degena Haile | $324,900 | -- | |
| Lang Andrew B | $200,535 | Land Title |
Source: Public Records
Mortgage History
| Date | Status | Borrower | Loan Amount |
|---|---|---|---|
| Open | Degena Haile | $259,920 | |
| Previous Owner | Lang Andrew B | $200,535 |
Source: Public Records
Tax History
| Year | Tax Paid | Tax Assessment Tax Assessment Total Assessment is a certain percentage of the fair market value that is determined by local assessors to be the total taxable value of land and additions on the property. | Land | Improvement |
|---|---|---|---|---|
| 2025 | $3,867 | $49,660 | $9,980 | $9,980 |
| 2024 | $3,867 | $48,820 | $5,800 | $43,020 |
| 2023 | $3,783 | $48,820 | $5,800 | $43,020 |
| 2022 | $3,207 | $40,330 | $7,650 | $32,680 |
| 2021 | $3,096 | $41,490 | $7,870 | $33,620 |
| 2020 | $2,997 | $40,400 | $7,870 | $32,530 |
| 2019 | $2,913 | $40,400 | $7,870 | $32,530 |
| 2018 | $2,620 | $33,860 | $6,790 | $27,070 |
| 2017 | $2,612 | $33,860 | $6,790 | $27,070 |
| 2016 | $2,689 | $32,970 | $7,506 | $25,464 |
| 2015 | $2,576 | $32,970 | $7,506 | $25,464 |
| 2014 | $2,498 | $30,080 | $4,585 | $25,495 |
Source: Public Records
Map
Nearby Homes
- 7821 E Archer Place
- 68 S Ulster St
- 8225 E Fairmount Dr Unit 204
- 8165 E Lowry Blvd Unit 209
- 8185 E Lowry Blvd Unit 105
- 8185 E Lowry Blvd Unit 302
- 7525 E 1st Place Unit A1012
- 7700 E Academy Blvd Unit 105
- 84 Spruce St Unit 603
- 85 Uinta Way Unit 106
- 85 Uinta Way Unit 702
- 159 Quebec St Unit D
- 159 Quebec St Unit B
- 209 Quebec St Unit L
- 8225 Fairmount Dr Unit 2-103
- 8225 Fairmount Dr Unit 203
- 301 S Poplar St
- 6971 E Lowry Blvd
- 222 S Olive St
- 7777 E 1st Place Unit 108
- 7782 E Archer Place
- 7822 E Archer Place
- 7762 E Archer Place
- 7842 E Archer Place
- 7803 E Bayaud Ave
- 7823 E Bayaud Ave
- 7783 E Bayaud Ave
- 7742 E Archer Place
- 7763 E Bayaud Ave
- 7862 E Archer Place
- 7843 E Bayaud Ave
- 1 E Archer Place
- 15 E Archer Place
- LOT 7 E Archer Place
- 7863 E Bayaud Ave
- 7743 E Bayaud Ave
- 7702 E Archer Place
- 7882 E Archer Place
- 7801 E Archer Place
- 7703 E Bayaud Ave
Your Personal Tour Guide
Ask me questions while you tour the home.