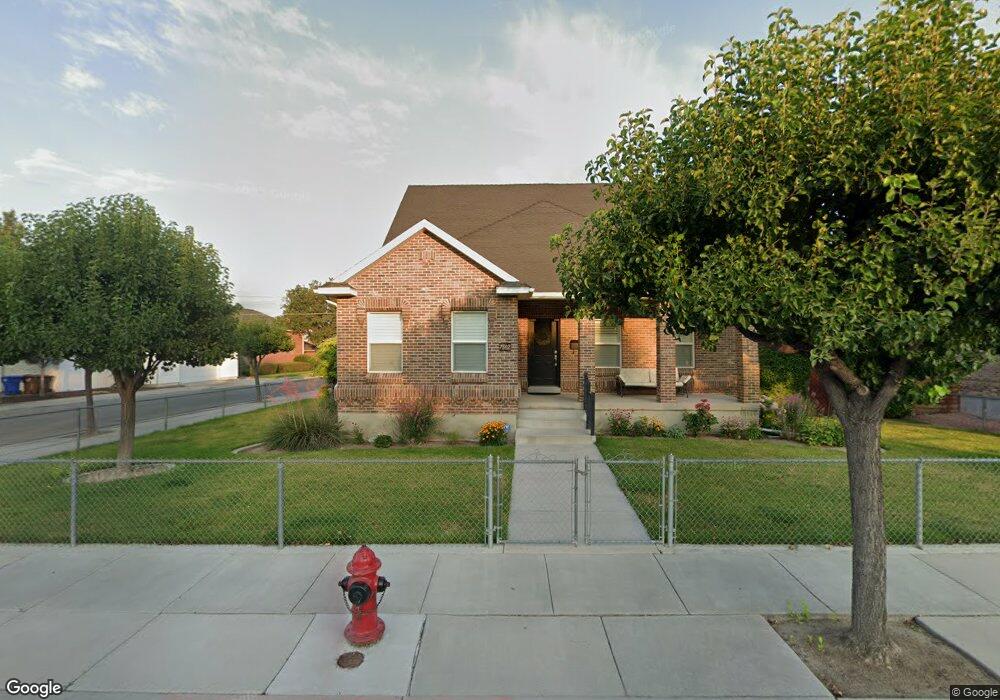
7802 Grant St Midvale, UT 84047
Estimated Value: $694,484 - $725,000
4
Beds
2
Baths
2,308
Sq Ft
$308/Sq Ft
Est. Value
About This Home
This home is located at 7802 Grant St, Midvale, UT 84047 and is currently estimated at $711,621, approximately $308 per square foot. 7802 Grant St is a home located in Salt Lake County with nearby schools including Midvale Elementary School, Midvale Middle School, and Hillcrest High School.
Ownership History
Date
Name
Owned For
Owner Type
Purchase Details
Closed on
Apr 9, 2020
Sold by
Smith Michael D
Bought by
Smith Michael Draney and Smith Miquelle Marie
Current Estimated Value
Home Financials for this Owner
Home Financials are based on the most recent Mortgage that was taken out on this home.
Original Mortgage
$282,000
Outstanding Balance
$249,818
Interest Rate
3.4%
Mortgage Type
New Conventional
Estimated Equity
$461,803
Purchase Details
Closed on
Apr 4, 2008
Sold by
Smith Michael D and Smith Miquelle M
Bought by
Smith Michael Draney and Smith Miquelle Marie
Purchase Details
Closed on
Aug 20, 2007
Sold by
Scheidle Michael
Bought by
Maxwell Jason Wayne and Maxwell Amy S
Purchase Details
Closed on
Jul 17, 2007
Sold by
Scheidle Michael F
Bought by
Smith Michael D and Smith Miquelle M
Create a Home Valuation Report for This Property
The Home Valuation Report is an in-depth analysis detailing your home's value as well as a comparison with similar homes in the area
Home Values in the Area
Average Home Value in this Area
Purchase History
| Date | Buyer | Sale Price | Title Company |
|---|---|---|---|
| Smith Michael Draney | -- | North American Title Llc | |
| Smith Michael D | -- | North American Title Llc | |
| Smith Michael Draney | -- | Cottonwood Title | |
| Maxwell Jason Wayne | -- | Accommodation | |
| Smith Michael D | -- | Accommodation |
Source: Public Records
Mortgage History
| Date | Status | Borrower | Loan Amount |
|---|---|---|---|
| Open | Smith Michael D | $282,000 |
Source: Public Records
Tax History
| Year | Tax Paid | Tax Assessment Tax Assessment Total Assessment is a certain percentage of the fair market value that is determined by local assessors to be the total taxable value of land and additions on the property. | Land | Improvement |
|---|---|---|---|---|
| 2025 | $3,841 | $681,800 | $136,100 | $545,700 |
| 2024 | $3,841 | $655,200 | $128,800 | $526,400 |
| 2023 | $3,741 | $633,600 | $122,400 | $511,200 |
| 2022 | $3,992 | $660,200 | $120,000 | $540,200 |
| 2021 | $3,674 | $521,400 | $110,000 | $411,400 |
| 2020 | $3,281 | $441,200 | $80,000 | $361,200 |
| 2019 | $2,952 | $387,500 | $75,000 | $312,500 |
| 2016 | $3,241 | $404,100 | $75,000 | $329,100 |
Source: Public Records
Map
Nearby Homes
- 197 W Center St
- 222 W Center St
- 108 W Ryker Ln Unit 16
- 7571 S Blisswood Dr #20 Dr Unit 20
- 139 W Columbia Dr
- 8147 S Roosevelt St
- 332 W Harvard Dr
- 150 W 7500 S Unit 55
- 150 W 7500 S Unit 29
- 150 W 7500 S Unit 53
- 396 Harvard Dr
- 30 W 7500 S Unit 18
- 8218 S Coolidge St
- 7373 S Wood Lily Ct Unit 24
- 7369 S Wood Lily Ct Unit 23
- 7365 S Wood Lily Ct Unit 22
- 7361 S Wood Lily Ct Unit 21
- 7375 S Dewmar Ct Unit 36
- 76 Marquette Dr
- 7357 S Wood Lily Ct Unit 20
Your Personal Tour Guide
Ask me questions while you tour the home.