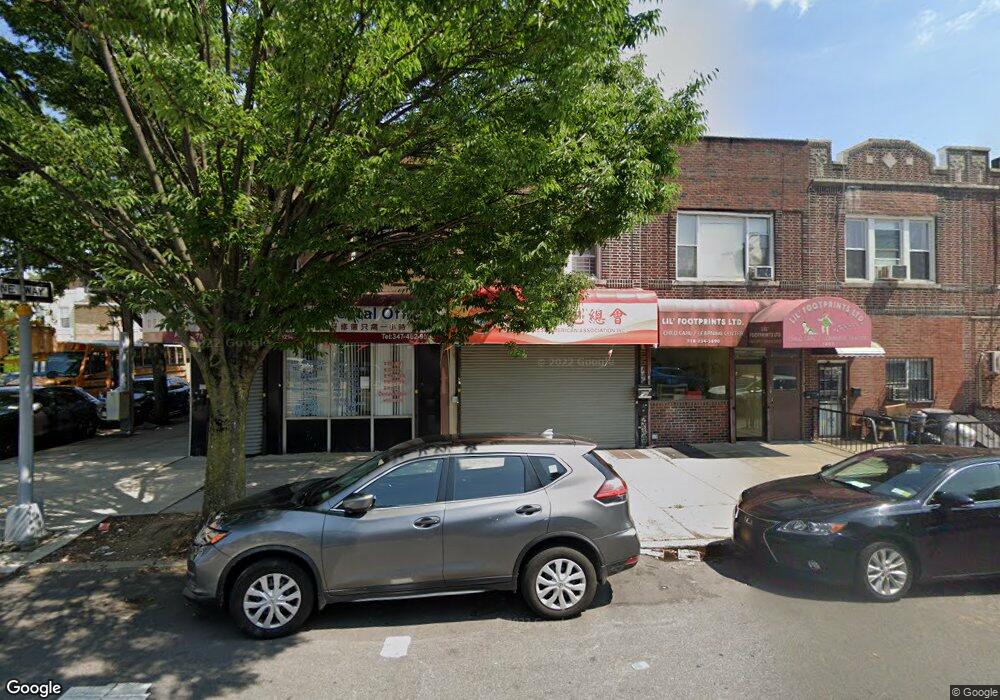
7803 20th Ave Brooklyn, NY 11214
Bensonhurst NeighborhoodEstimated Value: $1,086,873
Studio
--
Bath
1,920
Sq Ft
$566/Sq Ft
Est. Value
About This Home
This home is located at 7803 20th Ave, Brooklyn, NY 11214 and is currently estimated at $1,086,873, approximately $566 per square foot. 7803 20th Ave is a home located in Kings County with nearby schools including P.S. 186 Dr. Irving A. Gladstone Elementary School, Seth Low Intermediate School 96, and James Madison High School.
Ownership History
Date
Name
Owned For
Owner Type
Purchase Details
Closed on
Jan 4, 2018
Sold by
Mironov Leonard V
Bought by
Chung Pui Ying and Wang Solomon Hin
Current Estimated Value
Purchase Details
Closed on
Jan 24, 2014
Sold by
Leonard V Mironov Trustee and The Mironov Premises Trust
Bought by
Mironov Leonard V
Purchase Details
Closed on
Oct 8, 2007
Sold by
Mironov Genya
Bought by
Mironov Premises Trust and Mironov As Trustee Leonard V
Purchase Details
Closed on
Dec 17, 1997
Sold by
Mironov Leonard V and Mironov Genya
Bought by
Krasnerman Michael
Home Financials for this Owner
Home Financials are based on the most recent Mortgage that was taken out on this home.
Original Mortgage
$140,000
Interest Rate
6.9%
Mortgage Type
Seller Take Back
Create a Home Valuation Report for This Property
The Home Valuation Report is an in-depth analysis detailing your home's value as well as a comparison with similar homes in the area
Home Values in the Area
Average Home Value in this Area
Purchase History
| Date | Buyer | Sale Price | Title Company |
|---|---|---|---|
| Chung Pui Ying | $1,065,000 | -- | |
| Chung Pui Ying | $1,065,000 | -- | |
| Chung Pui Ying | $1,065,000 | -- | |
| Mironov Leonard V | -- | -- | |
| Mironov Leonard V | -- | -- | |
| Mironov Premises Trust | -- | -- | |
| Mironov Premises Trust | -- | -- | |
| Krasnerman Michael | $140,000 | -- | |
| Mironov Leonard | $200,000 | Lawyers Title Insurance Corp | |
| Krasnerman Michael | $140,000 | Lawyers Title Insurance Corp |
Source: Public Records
Mortgage History
| Date | Status | Borrower | Loan Amount |
|---|---|---|---|
| Previous Owner | Krasnerman Michael | $140,000 | |
| Previous Owner | Krasnerman Michael | $0 |
Source: Public Records
Tax History
| Year | Tax Paid | Tax Assessment Tax Assessment Total Assessment is a certain percentage of the fair market value that is determined by local assessors to be the total taxable value of land and additions on the property. | Land | Improvement |
|---|---|---|---|---|
| 2025 | $7,155 | $61,260 | $12,780 | $48,480 |
| 2024 | $7,155 | $64,500 | $12,780 | $51,720 |
| 2023 | $6,826 | $67,800 | $12,780 | $55,020 |
| 2022 | $6,298 | $55,920 | $12,780 | $43,140 |
| 2021 | $6,962 | $51,120 | $12,780 | $38,340 |
| 2020 | $6,661 | $59,100 | $12,780 | $46,320 |
| 2019 | $6,210 | $62,220 | $12,780 | $49,440 |
| 2018 | $5,709 | $28,008 | $6,905 | $21,103 |
| 2017 | $5,651 | $27,720 | $7,325 | $20,395 |
| 2016 | $5,541 | $27,720 | $8,786 | $18,934 |
| 2015 | $3,154 | $26,224 | $9,974 | $16,250 |
| 2014 | $3,154 | $24,740 | $11,284 | $13,456 |
Source: Public Records
Map
Nearby Homes
- 2039 78th St
- 2024 80th St
- 1927 78th St Unit 4A
- 2101 76th St
- 2125 77th St
- 1939 80th St
- 1973 81st St Unit C10
- 2029 82nd St
- 1912 Bay Ridge Pkwy
- 2040 73rd St
- 2172 76th St
- 2150 80th St
- 7608 Bay Pkwy Unit 5C
- 7608 Bay Pkwy Unit 8C
- 1859 80th St
- 7516 Bay Pkwy Unit 4E
- 2152 81st St Unit 2A
- 7819 Bay Pkwy Unit PH
- 1827 78th St Unit 1B
- 7201 20th Ave
Your Personal Tour Guide
Ask me questions while you tour the home.