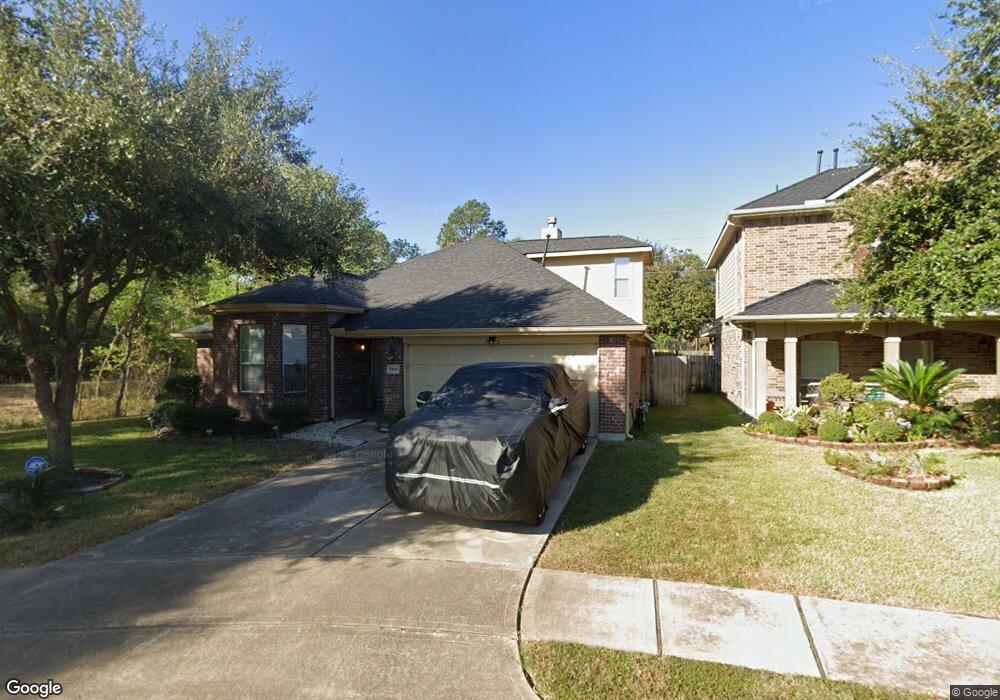
7803 Crystal Moon Dr Houston, TX 77040
North Houston NeighborhoodEstimated Value: $374,009 - $389,000
4
Beds
3
Baths
2,832
Sq Ft
$135/Sq Ft
Est. Value
About This Home
This home is located at 7803 Crystal Moon Dr, Houston, TX 77040 and is currently estimated at $381,252, approximately $134 per square foot. 7803 Crystal Moon Dr is a home located in Harris County with nearby schools including Reed Elementary School, Dean Middle School, and Jersey Village High School.
Ownership History
Date
Name
Owned For
Owner Type
Purchase Details
Closed on
Aug 6, 2015
Sold by
Melchor Christine and Villareal Aaron
Bought by
Johnson Jacqueline
Current Estimated Value
Home Financials for this Owner
Home Financials are based on the most recent Mortgage that was taken out on this home.
Original Mortgage
$176,739
Outstanding Balance
$140,590
Interest Rate
4.37%
Mortgage Type
FHA
Estimated Equity
$240,662
Purchase Details
Closed on
May 29, 2008
Sold by
Taylor Morrison Of Texas Inc
Bought by
Villareal Aaron and Melchor Christine
Home Financials for this Owner
Home Financials are based on the most recent Mortgage that was taken out on this home.
Original Mortgage
$205,911
Interest Rate
6.07%
Mortgage Type
FHA
Purchase Details
Closed on
Feb 11, 2008
Sold by
Sowell Interests Terrace Lp
Bought by
Taylor Morrison Of Texas Inc and Morrison Homes Of Texas Inc
Create a Home Valuation Report for This Property
The Home Valuation Report is an in-depth analysis detailing your home's value as well as a comparison with similar homes in the area
Home Values in the Area
Average Home Value in this Area
Purchase History
| Date | Buyer | Sale Price | Title Company |
|---|---|---|---|
| Johnson Jacqueline | -- | None Available | |
| Villareal Aaron | -- | Advantage Title Of Ft Bend | |
| Taylor Morrison Of Texas Inc | -- | Advantage Title Of Ft Bend |
Source: Public Records
Mortgage History
| Date | Status | Borrower | Loan Amount |
|---|---|---|---|
| Open | Johnson Jacqueline | $176,739 | |
| Previous Owner | Villareal Aaron | $205,911 |
Source: Public Records
Tax History Compared to Growth
Tax History
| Year | Tax Paid | Tax Assessment Tax Assessment Total Assessment is a certain percentage of the fair market value that is determined by local assessors to be the total taxable value of land and additions on the property. | Land | Improvement |
|---|---|---|---|---|
| 2025 | $7,239 | $393,108 | $55,446 | $337,662 |
| 2024 | $7,239 | $419,731 | $55,446 | $364,285 |
| 2023 | $7,239 | $406,502 | $55,446 | $351,056 |
| 2022 | $8,784 | $382,210 | $50,525 | $331,685 |
| 2021 | $8,407 | $294,873 | $50,525 | $244,348 |
| 2020 | $8,297 | $283,252 | $36,089 | $247,163 |
| 2019 | $7,803 | $257,052 | $33,465 | $223,587 |
| 2018 | $2,601 | $257,052 | $33,465 | $223,587 |
| 2017 | $8,190 | $257,052 | $33,465 | $223,587 |
| 2016 | $7,711 | $242,019 | $33,465 | $208,554 |
| 2015 | $5,340 | $238,624 | $33,465 | $205,159 |
| 2014 | $5,340 | $198,576 | $33,465 | $165,111 |
Source: Public Records
Map
Nearby Homes
- 8403 Cienna Dr
- 7823 Redlands Dr
- 8315 Whisper Point Dr
- 8115 Oahu Ct
- 8315 Terrace Brook Dr
- 8202 Terrace Brook Dr
- 8006 Summer Trail Dr
- 7915 Corrian Park Cir
- 7926 Westington Ln
- 8418 Westnut Ln
- 7802 Percussion Place
- 8126 Ivan Reid Dr
- 8715 Andante Dr
- 10515 Ince Ln
- 8111 Ivan Reid Dr
- 8331 Westbank Ave
- 8131 Debbie Gay Dr
- 7706 Cloverlake Ct
- 7823 Lumber Jack Dr
- 7918 Battleoak Dr
- 7807 Crystal Moon Dr
- 7886 Winehill Ln
- 7882 Winehill Ln
- 7811 Crystal Moon Dr
- 7890 Winehill Ln
- 7878 Winehill Ln
- 7802 Crystal Moon Dr
- 7902 Winehill Ln
- 7815 Crystal Moon Dr
- 7806 Crystal Moon Dr
- 7874 Winehill Ln
- 7810 Crystal Moon Dr
- 7814 Crystal Moon Dr
- 7819 Crystal Moon Dr
- 7906 Winehill Ln
- 8203 Summertree Dr
- 8202 Holmwood Dr
- 7870 Winehill Ln
- 7803 Redland Woods Dr
- 7823 Crystal Moon Dr