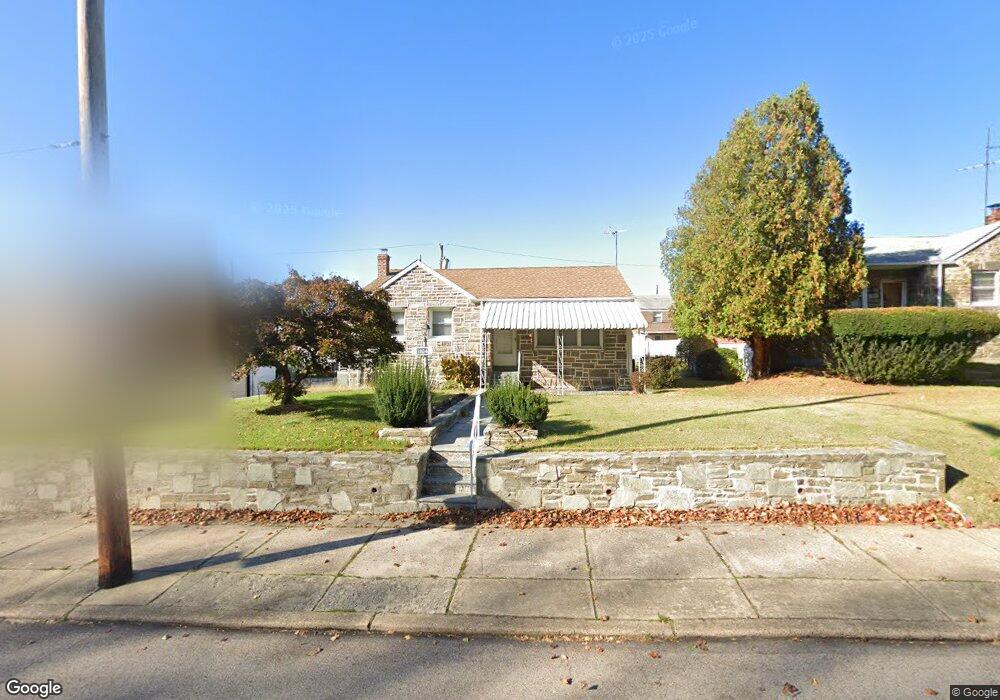
7804 Lexington Ave Philadelphia, PA 19152
Rhawnhurst NeighborhoodEstimated Value: $346,000 - $379,000
3
Beds
3
Baths
1,230
Sq Ft
$299/Sq Ft
Est. Value
About This Home
This home is located at 7804 Lexington Ave, Philadelphia, PA 19152 and is currently estimated at $368,261, approximately $299 per square foot. 7804 Lexington Ave is a home located in Philadelphia County with nearby schools including Lincoln High School, Meehan Austin Middle School, and Northeast Community Propel Academy.
Ownership History
Date
Name
Owned For
Owner Type
Purchase Details
Closed on
Jul 6, 2018
Sold by
Juley Nedumakel Jomon J and Juley Joseph
Bought by
Johnly Joise Joslin and Johnly Jose
Current Estimated Value
Home Financials for this Owner
Home Financials are based on the most recent Mortgage that was taken out on this home.
Original Mortgage
$201,750
Outstanding Balance
$174,847
Interest Rate
4.5%
Mortgage Type
New Conventional
Estimated Equity
$193,415
Purchase Details
Closed on
Mar 30, 2010
Sold by
Mathew Miny
Bought by
Juley Nedumakel Jomon J and Juley Joseph
Home Financials for this Owner
Home Financials are based on the most recent Mortgage that was taken out on this home.
Original Mortgage
$202,268
Interest Rate
5.5%
Mortgage Type
FHA
Purchase Details
Closed on
Aug 8, 2006
Sold by
Miny James Jomon and Miny Mathew
Bought by
Mathew Miny
Purchase Details
Closed on
Jun 30, 1999
Sold by
Nedumakel Thomas and Thomas Marykutty
Bought by
Miny James Jomon and Miny Mathew
Create a Home Valuation Report for This Property
The Home Valuation Report is an in-depth analysis detailing your home's value as well as a comparison with similar homes in the area
Home Values in the Area
Average Home Value in this Area
Purchase History
| Date | Buyer | Sale Price | Title Company |
|---|---|---|---|
| Johnly Joise Joslin | $208,000 | All State Abstract Inc | |
| Juley Nedumakel Jomon J | $206,000 | None Available | |
| Mathew Miny | -- | None Available | |
| Miny James Jomon | $111,000 | -- |
Source: Public Records
Mortgage History
| Date | Status | Borrower | Loan Amount |
|---|---|---|---|
| Open | Johnly Joise Joslin | $201,750 | |
| Previous Owner | Juley Nedumakel Jomon J | $202,268 |
Source: Public Records
Tax History Compared to Growth
Tax History
| Year | Tax Paid | Tax Assessment Tax Assessment Total Assessment is a certain percentage of the fair market value that is determined by local assessors to be the total taxable value of land and additions on the property. | Land | Improvement |
|---|---|---|---|---|
| 2025 | $4,205 | $357,200 | $71,440 | $285,760 |
| 2024 | $4,205 | $357,200 | $71,440 | $285,760 |
| 2023 | $4,205 | $300,400 | $60,080 | $240,320 |
| 2022 | $3,673 | $255,400 | $60,080 | $195,320 |
| 2021 | $3,673 | $0 | $0 | $0 |
| 2020 | $3,673 | $0 | $0 | $0 |
| 2019 | $3,557 | $0 | $0 | $0 |
| 2018 | $2,879 | $0 | $0 | $0 |
| 2017 | $2,879 | $0 | $0 | $0 |
| 2016 | $2,879 | $0 | $0 | $0 |
| 2015 | $2,756 | $0 | $0 | $0 |
| 2014 | -- | $205,700 | $74,970 | $130,730 |
| 2012 | -- | $32,384 | $8,848 | $23,536 |
Source: Public Records
Map
Nearby Homes
- 7703 Brous Ave
- 7722 Fairfield St
- 7914 Farnsworth St
- 2803 Rhawn St
- 2755 Rhawn St
- 2547 Shelmire Ave
- 7416 Revere St
- 3036 Nesper St
- 7418 Revere St
- 7525 Calvert St
- 7521 Calvert St
- 2727 Rhawn St
- 2727 Rhawn St Unit 7AB
- 8130 Farnsworth St
- 3011 Teesdale St
- 8142 Lister St
- 3034 Teesdale St
- 3222 Guilford St
- 3219 Teesdale St
- 3307 Shelmire Ave
- 7806 Lexington Ave
- 7802 Lexington Ave
- 7805 Brocklehurst St
- 7803 Brocklehurst St
- 7808 Lexington Ave
- 7800 Lexington Ave
- 7807 Brocklehurst St
- 7801 Brocklehurst St
- 7809 Brocklehurst St
- 7810 Lexington Ave
- 7811 Brocklehurst St
- 7812 Lexington Ave
- 7813 Brocklehurst St
- 7802 Brocklehurst St
- 7804 Brocklehurst St
- 7800 Brocklehurst St
- 7715 Brocklehurst St
- 7806 Brocklehurst St
- 7712 Lexington Ave
- 7814 Lexington Ave