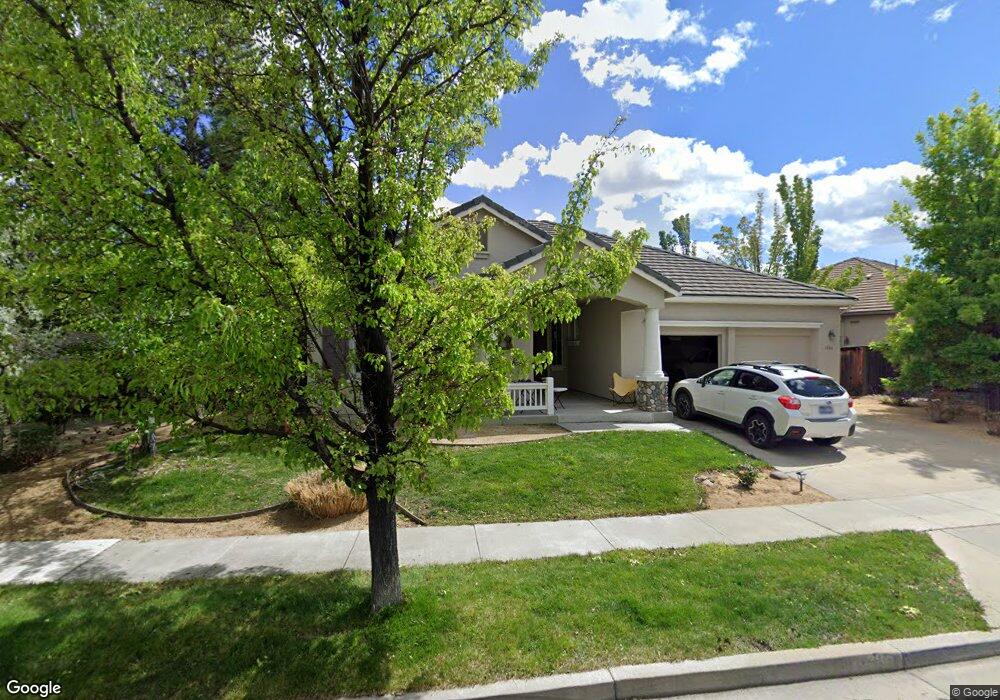
7804 Morgan Pointe Cir Reno, NV 89523
Somersett NeighborhoodEstimated Value: $629,269 - $800,000
3
Beds
2
Baths
1,676
Sq Ft
$414/Sq Ft
Est. Value
About This Home
This home is located at 7804 Morgan Pointe Cir, Reno, NV 89523 and is currently estimated at $694,067, approximately $414 per square foot. 7804 Morgan Pointe Cir is a home located in Washoe County with nearby schools including B D Billinghurst Middle School, Robert McQueen High School, and Riverview Christian Academy.
Ownership History
Date
Name
Owned For
Owner Type
Purchase Details
Closed on
Apr 23, 2014
Sold by
Richerson Rodney Gerald and Richerson Rachel Lynn
Bought by
The Richerson Family Trust
Current Estimated Value
Purchase Details
Closed on
Apr 18, 2007
Sold by
Richerson Rodney Gerard and Richerson Rachel Lynn
Bought by
Richerson Rodney Gerard and Richerson Rachel Lynn
Purchase Details
Closed on
Dec 4, 2002
Sold by
Morgan Pointe Llc
Bought by
Richerson Rodney Gerald and Richerson Rachel Lynn
Home Financials for this Owner
Home Financials are based on the most recent Mortgage that was taken out on this home.
Original Mortgage
$253,200
Outstanding Balance
$90,364
Interest Rate
4.25%
Mortgage Type
Unknown
Estimated Equity
$603,703
Create a Home Valuation Report for This Property
The Home Valuation Report is an in-depth analysis detailing your home's value as well as a comparison with similar homes in the area
Home Values in the Area
Average Home Value in this Area
Purchase History
| Date | Buyer | Sale Price | Title Company |
|---|---|---|---|
| The Richerson Family Trust | -- | None Available | |
| Richerson Rodney Gerard | -- | Ticor Title Of Nevada Inc | |
| Richerson Rodney Gerald | $305,825 | Inter County Title Co |
Source: Public Records
Mortgage History
| Date | Status | Borrower | Loan Amount |
|---|---|---|---|
| Open | Richerson Rodney Gerald | $253,200 | |
| Closed | Richerson Rodney Gerald | $31,550 |
Source: Public Records
Tax History
| Year | Tax Paid | Tax Assessment Tax Assessment Total Assessment is a certain percentage of the fair market value that is determined by local assessors to be the total taxable value of land and additions on the property. | Land | Improvement |
|---|---|---|---|---|
| 2026 | -- | $140,006 | $53,765 | $86,240 |
| 2024 | $3,788 | $132,155 | $43,757 | $88,398 |
| 2023 | $2,835 | $129,231 | $45,619 | $83,612 |
| 2022 | $3,508 | $109,488 | $39,767 | $69,721 |
| 2021 | $3,250 | $99,215 | $29,859 | $69,356 |
| 2020 | $3,056 | $99,339 | $29,859 | $69,480 |
| 2019 | $2,910 | $92,632 | $25,603 | $67,029 |
| 2018 | $2,775 | $86,482 | $20,981 | $65,501 |
| 2017 | $2,637 | $85,672 | $20,981 | $64,691 |
| 2016 | $2,571 | $87,142 | $20,981 | $66,161 |
| 2015 | $2,566 | $88,044 | $21,679 | $66,365 |
| 2014 | $2,485 | $79,946 | $16,160 | $63,786 |
| 2013 | -- | $65,761 | $12,801 | $52,960 |
Source: Public Records
Map
Nearby Homes
- 1940 Morning Grove Ct
- 1593 River Hill Way
- 1601 River Hill Way
- 1598 River Hill Way
- 1642 Spring Hill Dr
- 1630 Spring Hill Dr
- 7604 Stone Bluff Way
- 1785 Dakota Ridge Trail
- 1530 River Hill Way
- 1075 Udowski Ct
- 1050 Udowski Ct
- 1045 Udowski Ct Unit Homesite 54
- 7310 Heritage Oaks Dr
- 00 Painted River Trail
- 2533 Whitney Oaks Ln
- 1660 Boulder Ridge Ct
- 8360 Cinnamon Ridge Ln
- 2595 Drake Wood Ct
- 2440 Mountain Spirit Trail
- 0 Unit 250003854
- 7812 Morgan Pointe Cir
- 7800 Morgan Pointe Cir
- 7819 Morgan Pointe Cir
- 7820 Morgan Pointe Cir
- 7811 Morgan Pointe Cir
- 7827 Morgan Pointe Cir
- 7835 Morgan Pointe Cir
- 7801 Morgan Pointe Cir
- 7826 Morgan Pointe Cir
- 7843 Morgan Pointe Cir
- 1840 Morgan Pointe Ct
- 1820 Morgan Pointe Ct
- 1850 Morgan Pointe Ct
- 7834 Morgan Pointe Cir
- 1860 Morgan Pointe Ct
- 7851 Morgan Pointe Cir
- 1870 Morgan Pointe Ct
- 7842 Morgan Pointe Cir
- 1880 Morgan Pointe Ct
- 7859 Morgan Pointe Cir
Your Personal Tour Guide
Ask me questions while you tour the home.