


7805 Cooper Ln Unit 208 Austin, TX 78745
South Austin NeighborhoodEstimated payment $2,398/month
Highlights
- Vaulted Ceiling
- Patio
- Community Barbecue Grill
- Open to Family Room
- Secured Garage or Parking
- Detached Carport Space
About This Home
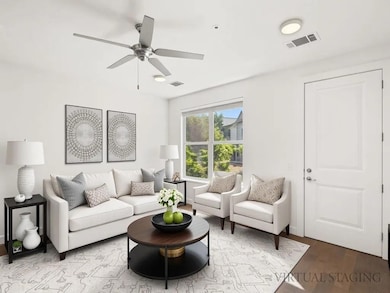
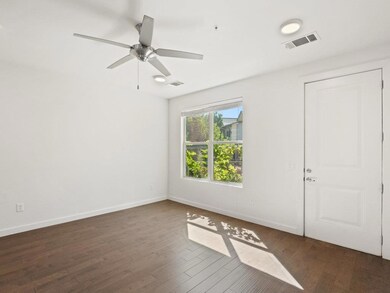
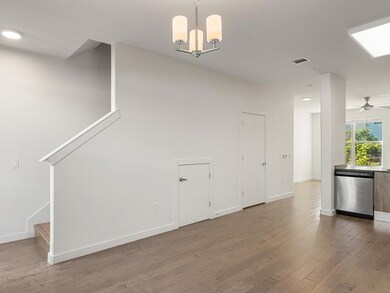
Ask us about our lender-paid financing incentive that lowers interest rate by 1% for two years! Welcome to 7805 Cooper Ln Unit 208, a modern residence set in a well-maintained community in South Austin. The front entry opens to a thoughtfully designed interior with a bright, open living area that flows seamlessly into the dining and kitchen spaces. The kitchen features contemporary cabinetry, stainless steel appliances, and a practical layout that makes daily living effortless. The primary bedroom offers comfort and privacy, while the additional rooms provide flexibility for work or guests. Step outside to a relaxing balcony space that captures the calm surroundings of the neighborhood. Enjoy access to full community amenities including a well-equipped gym with a bench, cable machine, and free weights, a refreshing pool, an on-site fenced dog run, and a welcoming community area. Just steps away, a neighboring food truck park adds to the vibrant and convenient lifestyle that defines this location.
Listing Agent
Keller Williams Realty Brokerage Phone: (512) 675-7653 License #0565374 Listed on: 10/11/2025

Co-Listing Agent
Keller Williams Realty Brokerage Phone: (512) 675-7653 License #0729856
Property Details
Home Type
- Condominium
Est. Annual Taxes
- $6,283
Year Built
- Built in 2016
Lot Details
- North Facing Home
- Back and Front Yard Fenced
- Landscaped
HOA Fees
- $400 Monthly HOA Fees
Parking
- 2 Car Garage
- Detached Carport Space
- Secured Garage or Parking
- Parking Lot
- Assigned Parking
Home Design
- Slab Foundation
- Shingle Roof
- Composition Roof
- Stone Siding
Interior Spaces
- 1,220 Sq Ft Home
- 2-Story Property
- Vaulted Ceiling
- Ceiling Fan
- Stacked Washer and Dryer
Kitchen
- Open to Family Room
- Oven
- Range
- Microwave
- Freezer
- Dishwasher
- Disposal
Flooring
- Laminate
- Vinyl
Bedrooms and Bathrooms
- 2 Bedrooms
Home Security
Outdoor Features
- Patio
Schools
- Williams Elementary School
- Paredes Middle School
- Akins High School
Utilities
- Central Air
- Heat Pump System
Listing and Financial Details
- Assessor Parcel Number 04231803130000
- Tax Block 200
Community Details
Overview
- Association fees include cable TV, common area maintenance, internet
- Cooper Villas Association
- Built by Brandon Miller Group
- Cooper Villas Condo Subdivision
Amenities
- Community Barbecue Grill
Security
- Carbon Monoxide Detectors
- Fire and Smoke Detector
Map
Home Values in the Area
Average Home Value in this Area
Tax History
| Year | Tax Paid | Tax Assessment Tax Assessment Total Assessment is a certain percentage of the fair market value that is determined by local assessors to be the total taxable value of land and additions on the property. | Land | Improvement |
|---|---|---|---|---|
| 2025 | $6,166 | $317,038 | $32,524 | $284,514 |
| 2023 | $8,071 | $446,106 | $32,524 | $413,582 |
| 2022 | $6,995 | $354,191 | $32,524 | $321,667 |
| 2021 | $5,786 | $265,822 | $32,524 | $233,298 |
| 2020 | $5,195 | $242,221 | $29,633 | $212,588 |
| 2019 | $5,320 | $242,221 | $29,633 | $212,588 |
| 2018 | $4,765 | $215,230 | $29,633 | $185,597 |
| 2017 | $1,174 | $52,640 | $4,630 | $48,010 |
Property History
| Date | Event | Price | List to Sale | Price per Sq Ft | Prior Sale |
|---|---|---|---|---|---|
| 10/11/2025 10/11/25 | For Sale | $279,997 | 0.0% | $230 / Sq Ft | |
| 02/09/2024 02/09/24 | Rented | $1,700 | 0.0% | -- | |
| 01/25/2024 01/25/24 | Under Contract | -- | -- | -- | |
| 01/10/2024 01/10/24 | For Rent | $1,700 | 0.0% | -- | |
| 02/20/2021 02/20/21 | Rented | $1,700 | 0.0% | -- | |
| 02/08/2021 02/08/21 | Under Contract | -- | -- | -- | |
| 01/14/2021 01/14/21 | Price Changed | $1,700 | -5.6% | $1 / Sq Ft | |
| 01/12/2021 01/12/21 | Price Changed | $1,800 | -2.7% | $1 / Sq Ft | |
| 10/29/2020 10/29/20 | Price Changed | $1,850 | -2.6% | $2 / Sq Ft | |
| 10/19/2020 10/19/20 | For Rent | $1,900 | +15.2% | -- | |
| 11/01/2019 11/01/19 | Rented | $1,650 | -5.7% | -- | |
| 10/03/2019 10/03/19 | Under Contract | -- | -- | -- | |
| 07/09/2019 07/09/19 | For Rent | $1,750 | +7.7% | -- | |
| 06/30/2018 06/30/18 | Rented | $1,625 | 0.0% | -- | |
| 06/14/2018 06/14/18 | Under Contract | -- | -- | -- | |
| 06/01/2018 06/01/18 | Price Changed | $1,625 | -1.5% | $1 / Sq Ft | |
| 05/08/2018 05/08/18 | For Rent | $1,650 | 0.0% | -- | |
| 04/13/2018 04/13/18 | Sold | -- | -- | -- | View Prior Sale |
| 02/22/2018 02/22/18 | Pending | -- | -- | -- | |
| 01/22/2018 01/22/18 | For Sale | $249,000 | -- | $204 / Sq Ft |
Purchase History
| Date | Type | Sale Price | Title Company |
|---|---|---|---|
| Vendors Lien | -- | None Available |
Mortgage History
| Date | Status | Loan Amount | Loan Type |
|---|---|---|---|
| Previous Owner | $199,200 | New Conventional |
Source: Unlock MLS (Austin Board of REALTORS®)
MLS Number: 5895494
APN: 874914
Disclaimer: Certain information contained herein is derived from information provided by parties other than Homes.com. All information provided is deemed reliable, but is not guaranteed to be accurate and should be independently verified.
![]() Based on information from the Austin Board of REALTORS® (alternatively, from ACTRIS). Neither the Board nor ACTRIS guarantees or is in any way responsible for its accuracy. All data is provided “AS IS” and with all faults. Data maintained by the Board or ACTRIS may not reflect all real estate activity in the market.
Based on information from the Austin Board of REALTORS® (alternatively, from ACTRIS). Neither the Board nor ACTRIS guarantees or is in any way responsible for its accuracy. All data is provided “AS IS” and with all faults. Data maintained by the Board or ACTRIS may not reflect all real estate activity in the market.
Information being provided is for consumers’ personal, non-commercial use and may not be used for any purpose other than to identify prospective properties consumers may be interested in purchasing.
The Digital Millennium Copyright Act of 1998, 17 U.S.C. § 512 (the “DMCA”) provides recourse for copyright owners who believe that material appearing on the Internet infringes their rights under U.S. copyright law. If you believe in good faith that any content or material made available in connection with our website or services infringes your copyright, you (or your agent) may send us a notice requesting that the content or material be removed, or access to it blocked.
Notices must be sent in writing by email to DMCAnotice@MLSGrid.com.
The DMCA requires that your notice of alleged copyright infringement include the following information:
(1) description of the copyrighted work that is the subject of claimed infringement;
(2) description of the alleged infringing content and information sufficient to permit us to locate the content;
(3) contact information for you, including your address, telephone number and email address;
(4) a statement by you that you have a good faith belief that the content in the manner complained of is not authorized by the copyright owner, or its agent, or by the operation of any law;
(5) a statement by you, signed under penalty of perjury, that the information in the notification is accurate and that you have the authority to enforce the copyrights that are claimed to be infringed; and
(6) a physical or electronic signature of the copyright owner or a person authorized to act on the copyright owner’s behalf. Failure to include all of the above information may result in the delay of the processing of your complaint.
- 7805 Cooper Ln Unit 402
- 7805 Cooper Ln Unit 103
- 635 W Dittmar Rd
- 616 W Dittmar Rd
- 7601 Cooper Ln Unit 16
- 607 Elderberry Cove
- 606 Elderberry Cove
- 712 Terrier Trail
- 715 Bernese Pass
- 519 Blackberry Dr
- 404 W Dittmar Rd
- 8204 Alcorn Cir
- 7321 Shadywood Dr
- 7317 Shadywood Dr
- 736 Wales Way
- 7711 Stephany Taylor Dr
- 7400 Broken Arrow Ln
- 7904 Persimmon Trail
- 415 Baldridge Dr
- 7107 Teaberry Dr
- 7805 Cooper Ln Unit 103
- 7805 Cooper Ln
- 7601 Cooper Ln Unit 25
- 7508 Elderberry Dr
- 7801 Coldstream Dr
- 7403 Brynner St Unit 59
- 8203 Beaver Brook Ln
- 8137 Huddleston Ln
- 722 Wales Way
- 7302 Shadywood Unit A Dr
- 736 Wales Way
- 7716 Stephany Taylor Dr
- 206 Verrado Path
- 7203 Barnsdale Way
- 7408 Merrick Ln Unit 42
- 305 Bridgeford Dr
- 7305 Conway Dr Unit 503
- 7211 Ray Charles Dr
- 7002 Skynook Dr
- 8512 Birmingham Dr