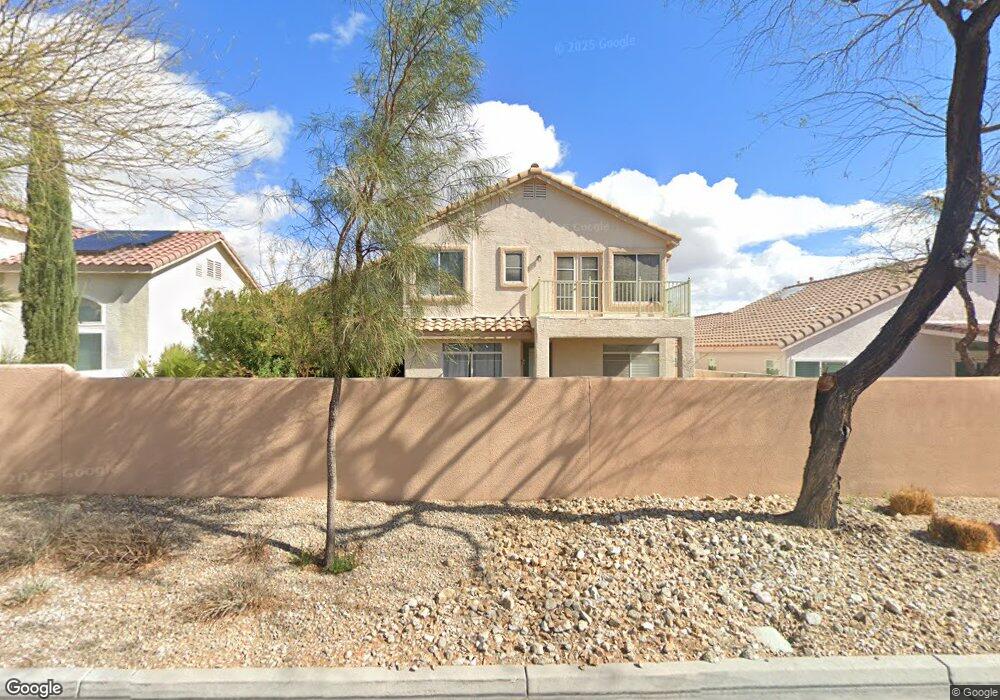
7805 Fort Ruby Place Unit 1 Las Vegas, NV 89128
Summerlin NeighborhoodEstimated Value: $539,742 - $596,000
5
Beds
3
Baths
2,294
Sq Ft
$253/Sq Ft
Est. Value
About This Home
This home is located at 7805 Fort Ruby Place Unit 1, Las Vegas, NV 89128 and is currently estimated at $579,436, approximately $252 per square foot. 7805 Fort Ruby Place Unit 1 is a home located in Clark County with nearby schools including Richard H. Bryan Elementary School, Ernest Becker Middle School, and Cimarron Memorial High School.
Ownership History
Date
Name
Owned For
Owner Type
Purchase Details
Closed on
Sep 11, 2002
Sold by
Freudenberger Stephan and Freudenberger Kim
Bought by
Graham David M and Graham Theresa M
Current Estimated Value
Home Financials for this Owner
Home Financials are based on the most recent Mortgage that was taken out on this home.
Original Mortgage
$198,000
Outstanding Balance
$83,496
Interest Rate
6.37%
Estimated Equity
$495,940
Purchase Details
Closed on
Aug 9, 1995
Sold by
Pac M Ltd Partnership
Bought by
Freudenberger Stephan and Freudenberger Kim
Home Financials for this Owner
Home Financials are based on the most recent Mortgage that was taken out on this home.
Original Mortgage
$142,400
Interest Rate
7.63%
Create a Home Valuation Report for This Property
The Home Valuation Report is an in-depth analysis detailing your home's value as well as a comparison with similar homes in the area
Home Values in the Area
Average Home Value in this Area
Purchase History
| Date | Buyer | Sale Price | Title Company |
|---|---|---|---|
| Graham David M | $220,000 | United Title | |
| Freudenberger Stephan | $182,500 | United Title |
Source: Public Records
Mortgage History
| Date | Status | Borrower | Loan Amount |
|---|---|---|---|
| Open | Graham David M | $198,000 | |
| Previous Owner | Freudenberger Stephan | $142,400 |
Source: Public Records
Tax History Compared to Growth
Tax History
| Year | Tax Paid | Tax Assessment Tax Assessment Total Assessment is a certain percentage of the fair market value that is determined by local assessors to be the total taxable value of land and additions on the property. | Land | Improvement |
|---|---|---|---|---|
| 2025 | $3,101 | $117,456 | $44,800 | $72,656 |
| 2024 | $2,872 | $117,456 | $44,800 | $72,656 |
| 2023 | $2,872 | $106,798 | $37,450 | $69,348 |
| 2022 | $2,659 | $96,006 | $32,550 | $63,456 |
| 2021 | $2,463 | $87,874 | $27,300 | $60,574 |
| 2020 | $2,284 | $89,974 | $29,750 | $60,224 |
| 2019 | $2,140 | $84,981 | $25,550 | $59,431 |
| 2018 | $2,042 | $79,145 | $22,050 | $57,095 |
| 2017 | $2,569 | $78,350 | $20,300 | $58,050 |
| 2016 | $1,912 | $72,705 | $14,700 | $58,005 |
| 2015 | $1,908 | $65,433 | $11,550 | $53,883 |
| 2014 | $1,852 | $54,789 | $9,800 | $44,989 |
Source: Public Records
Map
Nearby Homes
- 1704 Jack Rabbit Way
- 1812 Jack Rabbit Way
- 7837 Fort Ruby Place
- 7708 Vista Hills Dr
- 7709 Bauble Ave
- 7721 Rockfield Dr
- 7608 Haskell Flats Dr
- 7716 Constanso Ave Unit 103
- 7625 Almeria Ave
- 7700 Constanso Ave Unit 204
- 1900 Rio Canyon Ct Unit 102
- 1508 Blackcombe St Unit 104
- 7605 Almeria Ave
- 1830 N Buffalo Dr Unit 2115
- 1830 N Buffalo Dr Unit 2084
- 1830 N Buffalo Dr Unit 2083
- 1500 Truett St Unit 201
- 1501 Blackcombe St Unit 202
- 1908 Desert Falls Ct Unit 111
- 7709 Himalayas Ave Unit 201
- 7801 Fort Ruby Place
- 7809 Fort Ruby Place
- 7813 Fort Ruby Place
- 7804 Fort Ruby Place
- 7800 Fort Ruby Place
- 7808 Fort Ruby Place
- 7817 Fort Ruby Place
- 7812 Fort Ruby Place
- 1700 Jack Rabbit Way
- 7836 Desert Bell Ave
- 7832 Desert Bell Ave
- 7840 Desert Bell Ave
- 7844 Desert Bell Ave
- 7828 Desert Bell Ave
- 7816 Fort Ruby Place Unit 1
- 1712 Jack Rabbit Way
- 1721 Jack Rabbit Way Unit 1
- 7848 Desert Bell Ave
- 7824 Desert Bell Ave
- 7820 Fort Ruby Place