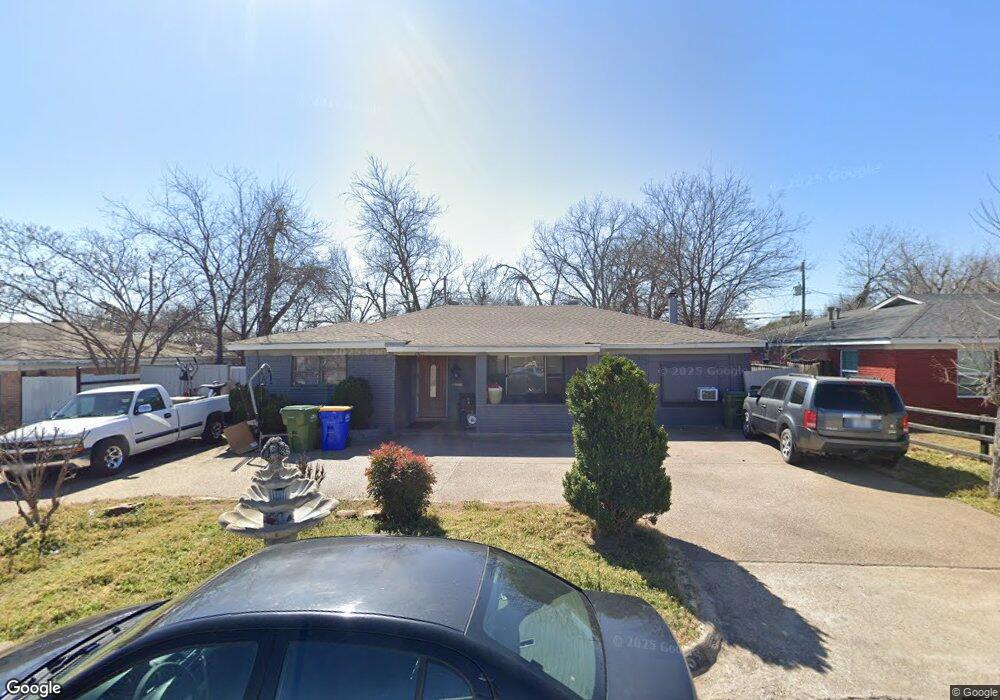
7805 Marrett Dr Fort Worth, TX 76108
Estimated Value: $218,000 - $287,383
3
Beds
2
Baths
2,484
Sq Ft
$105/Sq Ft
Est. Value
About This Home
This home is located at 7805 Marrett Dr, Fort Worth, TX 76108 and is currently estimated at $261,096, approximately $105 per square foot. 7805 Marrett Dr is a home located in Tarrant County with nearby schools including Liberty Elementary School, Brewer Middle School, and Tannahill Intermediate School.
Ownership History
Date
Name
Owned For
Owner Type
Purchase Details
Closed on
Dec 31, 2004
Sold by
Tucker Ricky A and Tucker Connie M
Bought by
Luna Jose and Luna Teresa
Current Estimated Value
Home Financials for this Owner
Home Financials are based on the most recent Mortgage that was taken out on this home.
Original Mortgage
$88,609
Outstanding Balance
$44,708
Interest Rate
5.74%
Mortgage Type
FHA
Estimated Equity
$216,388
Purchase Details
Closed on
Jun 8, 1998
Sold by
Hud
Bought by
Tucker Ricky A
Home Financials for this Owner
Home Financials are based on the most recent Mortgage that was taken out on this home.
Original Mortgage
$41,710
Interest Rate
7.17%
Mortgage Type
FHA
Purchase Details
Closed on
Oct 7, 1997
Sold by
Mountain States Mtg Centers Inc
Bought by
Hud
Create a Home Valuation Report for This Property
The Home Valuation Report is an in-depth analysis detailing your home's value as well as a comparison with similar homes in the area
Home Values in the Area
Average Home Value in this Area
Purchase History
| Date | Buyer | Sale Price | Title Company |
|---|---|---|---|
| Luna Jose | -- | Alamo Title Company | |
| Tucker Ricky A | $43,000 | -- | |
| Hud | -- | -- | |
| Mountain States Mtg Center Inc | $56,477 | -- |
Source: Public Records
Mortgage History
| Date | Status | Borrower | Loan Amount |
|---|---|---|---|
| Open | Luna Jose | $88,609 | |
| Previous Owner | Tucker Ricky A | $41,710 |
Source: Public Records
Tax History Compared to Growth
Tax History
| Year | Tax Paid | Tax Assessment Tax Assessment Total Assessment is a certain percentage of the fair market value that is determined by local assessors to be the total taxable value of land and additions on the property. | Land | Improvement |
|---|---|---|---|---|
| 2025 | $1,081 | $269,445 | $35,710 | $233,735 |
| 2024 | $1,081 | $269,445 | $35,710 | $233,735 |
| 2023 | $4,072 | $286,783 | $35,710 | $251,073 |
| 2022 | $4,217 | $233,005 | $25,000 | $208,005 |
| 2021 | $3,894 | $216,548 | $25,000 | $191,548 |
| 2020 | $3,566 | $187,233 | $25,000 | $162,233 |
| 2019 | $3,365 | $189,837 | $25,000 | $164,837 |
| 2018 | $1,000 | $106,347 | $12,000 | $94,347 |
| 2017 | $2,825 | $104,514 | $12,000 | $92,514 |
| 2016 | $2,568 | $105,347 | $12,000 | $93,347 |
| 2015 | $1,953 | $79,900 | $9,000 | $70,900 |
| 2014 | $1,953 | $79,900 | $9,000 | $70,900 |
Source: Public Records
Map
Nearby Homes
- 7805 Whitney Dr
- 7836 Corina Dr
- 730 S Cherry Ln
- 149 Wilson Cliff Dr
- 852 Odie Dr
- 867 Odie Dr
- 501 Odie Dr
- 801 Ala Dr
- 2248 Tierra Madre Blvd
- 537 June Dr
- 7704 Carlos St
- 2220 Crested Saguaro St
- 2228 Crested Saguaro St
- 633 Kimbrough St
- 8017 White Settlement Rd
- 872 June Dr
- 9752 New Bern Dr
- 10708 Gun Barrel St
- 10728 Gun Barrel St
- 321 Meadow Park Dr
- 7809 Marrett Dr
- 7801 Marrett Dr
- 7804 Whitney Dr
- 7813 Marrett Dr
- 7808 Whitney Dr
- 7800 Whitney Dr
- 7812 Whitney Dr
- 7817 Marrett Dr
- 7816 Whitney Dr
- 7821 Marrett Dr
- 7801 Whitney Dr
- 7809 Whitney Dr
- 7820 Whitney Dr
- 7813 Whitney Dr
- 7825 Marrett Dr
- 7817 Whitney Dr
- 7824 Whitney Dr
- 7829 Marrett Dr
- 7804 Terry St
- 7821 Whitney Dr