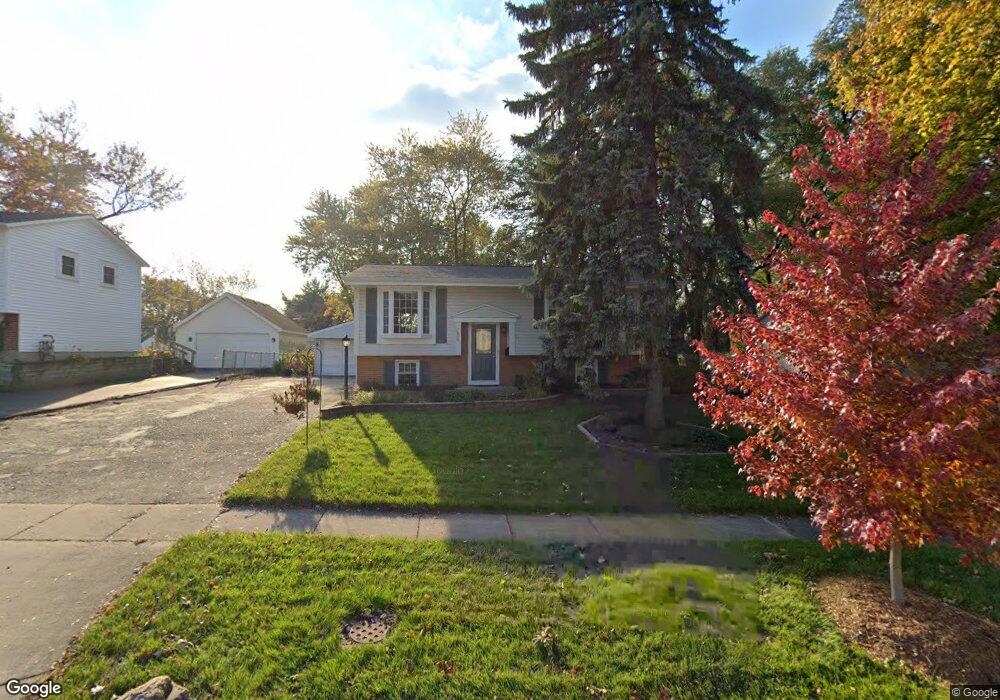
7806 Catalpa Ave Woodridge, IL 60517
West 83rd NeighborhoodEstimated Value: $326,000 - $360,000
--
Bed
--
Bath
987
Sq Ft
$346/Sq Ft
Est. Value
About This Home
This home is located at 7806 Catalpa Ave, Woodridge, IL 60517 and is currently estimated at $341,492, approximately $345 per square foot. 7806 Catalpa Ave is a home located in DuPage County with nearby schools including Edgewood Elementary School, Thomas Jefferson Junior High School, and Downers Grove South High School.
Ownership History
Date
Name
Owned For
Owner Type
Purchase Details
Closed on
Sep 9, 2019
Sold by
Copeland Robert C and Foley Monica M
Bought by
Copeland Robert C and Foley Monica M
Current Estimated Value
Purchase Details
Closed on
Dec 8, 2000
Sold by
Crumly Judith S and Crumly Thomas L
Bought by
Copeland Robert C and Foley Monica M
Home Financials for this Owner
Home Financials are based on the most recent Mortgage that was taken out on this home.
Original Mortgage
$129,600
Outstanding Balance
$48,103
Interest Rate
7.8%
Estimated Equity
$293,389
Purchase Details
Closed on
Nov 21, 1998
Sold by
Pritchett Gregory A and Pritchett Peggy A
Bought by
Crumly Thomas L and Crumly Judith S
Home Financials for this Owner
Home Financials are based on the most recent Mortgage that was taken out on this home.
Original Mortgage
$141,105
Interest Rate
6.83%
Mortgage Type
FHA
Create a Home Valuation Report for This Property
The Home Valuation Report is an in-depth analysis detailing your home's value as well as a comparison with similar homes in the area
Home Values in the Area
Average Home Value in this Area
Purchase History
| Date | Buyer | Sale Price | Title Company |
|---|---|---|---|
| Copeland Robert C | -- | Attorney | |
| Copeland Robert C | $162,000 | -- | |
| Crumly Thomas L | $145,000 | -- |
Source: Public Records
Mortgage History
| Date | Status | Borrower | Loan Amount |
|---|---|---|---|
| Open | Copeland Robert C | $129,600 | |
| Previous Owner | Crumly Thomas L | $141,105 |
Source: Public Records
Tax History Compared to Growth
Tax History
| Year | Tax Paid | Tax Assessment Tax Assessment Total Assessment is a certain percentage of the fair market value that is determined by local assessors to be the total taxable value of land and additions on the property. | Land | Improvement |
|---|---|---|---|---|
| 2024 | $7,703 | $103,620 | $58,039 | $45,581 |
| 2023 | $7,348 | $94,570 | $52,970 | $41,600 |
| 2022 | $6,606 | $83,690 | $46,880 | $36,810 |
| 2021 | $6,228 | $78,810 | $45,110 | $33,700 |
| 2020 | $6,134 | $77,390 | $44,300 | $33,090 |
| 2019 | $5,939 | $74,040 | $42,380 | $31,660 |
| 2018 | $5,548 | $67,310 | $38,530 | $28,780 |
| 2017 | $5,390 | $65,040 | $37,230 | $27,810 |
| 2016 | $5,287 | $62,680 | $35,880 | $26,800 |
| 2015 | $5,194 | $59,030 | $33,790 | $25,240 |
| 2014 | $5,354 | $59,030 | $33,790 | $25,240 |
| 2013 | $5,272 | $59,170 | $33,870 | $25,300 |
Source: Public Records
Map
Nearby Homes
- 2546 Jonquil Ln
- 7836 Catalpa Ave
- 7664 Willow Ave
- 7660 Walnut Ave
- 2732 Davos Ave
- 2852 Everglade Ave
- 2813 Forest Glen Pkwy
- 2302 Dalewood Pkwy
- 3 Oakview Ct
- 8040 Geneva St
- 2605 Willow Ave
- 2712 Mohawk Ave
- 7924 Westview Ln
- 3012 Scenicwood Ln
- 8119 Leawood Ln
- 3011 Scenicwood Ln
- 7830 Westview Ln
- 2100 Country Club Dr Unit 206E
- 2110 Country Club Dr Unit 197F
- 2220 Wharf Dr Unit 1906
- 7812 Catalpa Ave
- 7800 Catalpa Ave
- 7813 Sprucewood Ave
- 7803 Catalpa Ave
- 7760 Catalpa Ave
- 7811 Catalpa Ave
- 7809 Sprucewood Ave
- 7824 Catalpa Ave
- 2629 Jonquil Ln
- 7759 Catalpa Ave Unit 4
- 7819 Sprucewood Ave
- 7825 Sprucewood Ave
- 7817 Catalpa Ave
- 7803 Sprucewood Ave
- 2601 Jonquil Ln
- 2635 Jonquil Ln
- 7830 Catalpa Ave
- 7825 Catalpa Ave
- 7831 Sprucewood Ave
- 7761 Sprucewood Ave