Estimated Value: $383,000 - $451,000
4
Beds
3
Baths
2,779
Sq Ft
$148/Sq Ft
Est. Value
About This Home
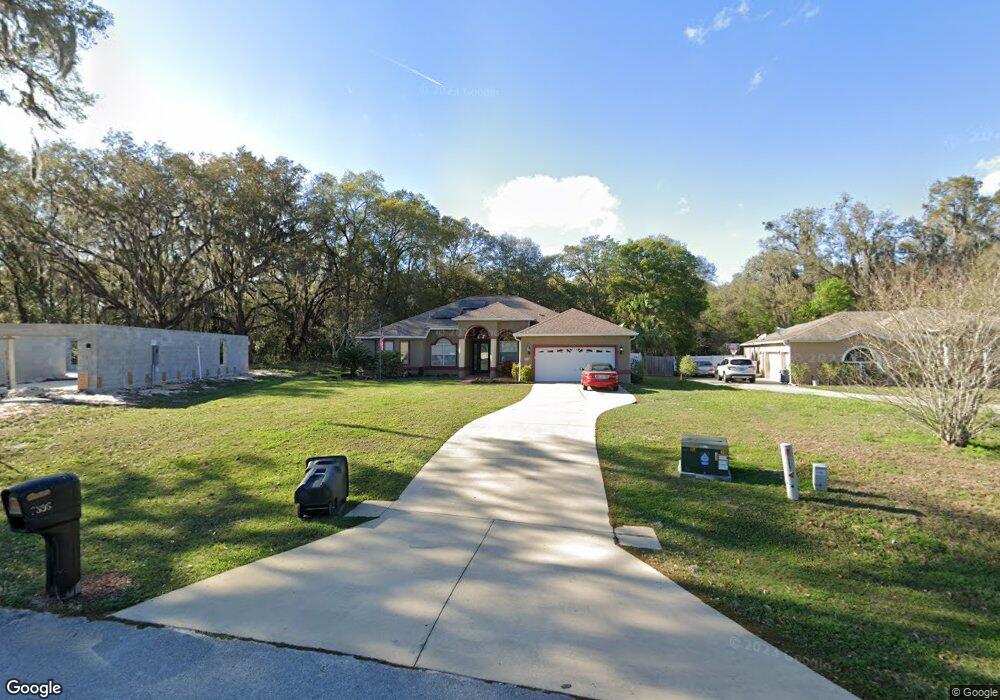
This home is located at 7806 SW 103rd Loop, Ocala, FL 34476 and is currently estimated at $410,415, approximately $147 per square foot. 7806 SW 103rd Loop is a home located in Marion County with nearby schools including Liberty Middle School, West Port High School, and Montessori House of Ocala.
Ownership History
Date
Name
Owned For
Owner Type
Purchase Details
Closed on
Dec 18, 2007
Sold by
Franc Linda R and Miller Cynthia
Bought by
Franc Linda R and Miller Craig A
Current Estimated Value
Purchase Details
Closed on
Apr 21, 2006
Sold by
Franc Linda R
Bought by
Franc Linda R and Miller Craig
Home Financials for this Owner
Home Financials are based on the most recent Mortgage that was taken out on this home.
Original Mortgage
$199,900
Outstanding Balance
$157,678
Interest Rate
6.49%
Mortgage Type
New Conventional
Estimated Equity
$252,738
Purchase Details
Closed on
Dec 31, 2003
Sold by
Heritage Custom Homes Inc
Bought by
Franc Linda R
Home Financials for this Owner
Home Financials are based on the most recent Mortgage that was taken out on this home.
Original Mortgage
$134,000
Interest Rate
5.87%
Mortgage Type
Purchase Money Mortgage
Purchase Details
Closed on
Jul 15, 2003
Sold by
Heritage Communities Inc
Bought by
Heritage Communities Inc
Create a Home Valuation Report for This Property
The Home Valuation Report is an in-depth analysis detailing your home's value as well as a comparison with similar homes in the area
Home Values in the Area
Average Home Value in this Area
Purchase History
| Date | Buyer | Sale Price | Title Company |
|---|---|---|---|
| Franc Linda R | -- | Attorney | |
| Franc Linda R | -- | K E L Title Ins Agency Inc | |
| Franc Linda R | $195,000 | Advance Homestead Title Inc | |
| Heritage Communities Inc | -- | -- |
Source: Public Records
Mortgage History
| Date | Status | Borrower | Loan Amount |
|---|---|---|---|
| Open | Franc Linda R | $199,900 | |
| Closed | Franc Linda R | $134,000 |
Source: Public Records
Tax History
| Year | Tax Paid | Tax Assessment Tax Assessment Total Assessment is a certain percentage of the fair market value that is determined by local assessors to be the total taxable value of land and additions on the property. | Land | Improvement |
|---|---|---|---|---|
| 2025 | $3,031 | $209,080 | -- | -- |
| 2024 | $2,777 | $203,188 | -- | -- |
| 2023 | $2,706 | $197,270 | $0 | $0 |
| 2022 | $2,700 | $191,524 | $0 | $0 |
| 2021 | $2,697 | $185,946 | $0 | $0 |
| 2020 | $2,675 | $183,379 | $0 | $0 |
| 2019 | $2,634 | $179,256 | $0 | $0 |
| 2018 | $2,497 | $175,914 | $0 | $0 |
| 2017 | $2,450 | $172,296 | $0 | $0 |
| 2016 | $2,407 | $168,752 | $0 | $0 |
| 2015 | $2,423 | $167,579 | $0 | $0 |
| 2014 | $2,280 | $166,249 | $0 | $0 |
Source: Public Records
Map
Nearby Homes
- 10090 SW 78th Ct
- 7830 SW 103rd Loop
- 10170 SW 78th Ct
- 10213 SW 78th Ct
- 8049 SW 100th Street Rd
- 7917 SW 103rd Loop
- 7604 SW 103rd Loop
- 10217 SW 74th Terrace
- 7558 SW 103rd Loop
- 8306 SW 100th Lane Rd
- 9812 SW 74th Ave
- 10522 SW 76th Ct
- 10571 SW 76th Ct
- 10308 SW 83rd Terrace
- 9865 SW 74th Ave
- 7846 SW St Rd 200
- 8329 SW 105th Place
- 5716 SW 71st Ct
- 10120 SW 71st Ct
- 9587 SW 84th Terrace Unit E
- 7814 SW 103rd Loop
- 7798 SW 103rd Loop
- 7822 SW 103rd Loop
- 7833 SW 103rd Loop Unit 36447441
- 7833 SW 103rd Loop Unit 36495924
- 7833 SW 103rd Loop Unit 36445529
- 7833 SW 103rd Loop Unit 36460199
- 7833 SW 103rd Loop Unit 36502882
- 7833 SW 103rd Loop Unit 36492489
- 7833 SW 103rd Loop Unit 36481175
- 7833 SW 103rd Loop Unit 36436906
- 7833 SW 103rd Loop
- 7790 SW 103rd Loop
- 7783 SW 103rd Loop
- 7782 SW 103rd Loop
- 7838 SW 103rd Loop
- 7775 SW 103rd Loop
- 8922 SW 78th Ct
- 7774 SW 103rd Loop
- 10098 SW 78th Ct
Your Personal Tour Guide
Ask me questions while you tour the home.