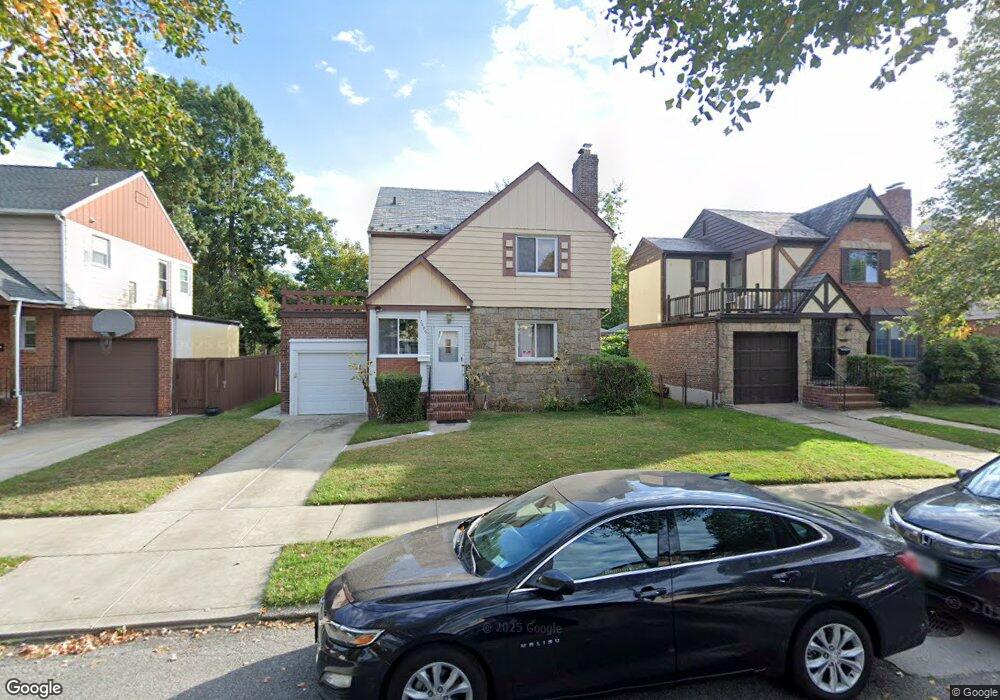
7809 223rd St Oakland Gardens, NY 11364
Oakland Gardens NeighborhoodEstimated Value: $1,070,000 - $1,143,173
3
Beds
2
Baths
1,672
Sq Ft
$667/Sq Ft
Est. Value
About This Home
This home is located at 7809 223rd St, Oakland Gardens, NY 11364 and is currently estimated at $1,116,043, approximately $667 per square foot. 7809 223rd St is a home located in Queens County with nearby schools including P.S. 188 - Kingsbury, Irwin Altman Middle School 172, and Martin Van Buren High School.
Ownership History
Date
Name
Owned For
Owner Type
Purchase Details
Closed on
Oct 25, 2024
Sold by
223 St Oakland Llc
Bought by
Nunez Sylvia J and Szczesny Steven J
Current Estimated Value
Home Financials for this Owner
Home Financials are based on the most recent Mortgage that was taken out on this home.
Original Mortgage
$852,000
Outstanding Balance
$843,454
Interest Rate
6.08%
Mortgage Type
Purchase Money Mortgage
Estimated Equity
$272,589
Purchase Details
Closed on
Nov 16, 2018
Sold by
Mancuso Jerri
Bought by
223 St Oakland Llc
Purchase Details
Closed on
Mar 4, 2016
Sold by
Lee Byung Hoon
Bought by
Mancuso Jerri
Purchase Details
Closed on
Jan 10, 2007
Sold by
Ii Lee Kyong and Lee Myong Suk
Bought by
Hoon Lee Byung and Young Lee Hae
Home Financials for this Owner
Home Financials are based on the most recent Mortgage that was taken out on this home.
Original Mortgage
$598,500
Interest Rate
6.15%
Create a Home Valuation Report for This Property
The Home Valuation Report is an in-depth analysis detailing your home's value as well as a comparison with similar homes in the area
Home Values in the Area
Average Home Value in this Area
Purchase History
| Date | Buyer | Sale Price | Title Company |
|---|---|---|---|
| Nunez Sylvia J | $1,065,000 | -- | |
| 223 St Oakland Llc | $615,000 | -- | |
| 223 St Oakland Llc | $615,000 | -- | |
| Mancuso Jerri | $495,000 | -- | |
| Mancuso Jerri | $495,000 | -- | |
| Hoon Lee Byung | $665,000 | -- | |
| Hoon Lee Byung | $665,000 | -- |
Source: Public Records
Mortgage History
| Date | Status | Borrower | Loan Amount |
|---|---|---|---|
| Open | Nunez Sylvia J | $852,000 | |
| Previous Owner | Hoon Lee Byung | $598,500 |
Source: Public Records
Tax History Compared to Growth
Tax History
| Year | Tax Paid | Tax Assessment Tax Assessment Total Assessment is a certain percentage of the fair market value that is determined by local assessors to be the total taxable value of land and additions on the property. | Land | Improvement |
|---|---|---|---|---|
| 2025 | $10,806 | $57,030 | $15,745 | $41,285 |
| 2024 | $10,806 | $53,803 | $15,460 | $38,343 |
| 2023 | $10,195 | $50,761 | $15,220 | $35,541 |
| 2022 | $6,145 | $65,640 | $21,120 | $44,520 |
| 2021 | $6,681 | $59,640 | $21,120 | $38,520 |
| 2020 | $6,310 | $60,480 | $21,120 | $39,360 |
| 2019 | $5,629 | $60,540 | $21,120 | $39,420 |
| 2018 | $8,623 | $42,301 | $17,134 | $25,167 |
| 2017 | $8,420 | $41,304 | $18,106 | $23,198 |
| 2016 | $8,257 | $41,304 | $18,106 | $23,198 |
| 2015 | $4,700 | $39,604 | $19,676 | $19,928 |
| 2014 | $4,700 | $37,364 | $21,234 | $16,130 |
Source: Public Records
Map
Nearby Homes
- 78-07 Springfield Blvd Unit B
- 80-35 Springfield Blvd Unit E-6
- 7807 Springfield Blvd Unit B
- 78-47 222nd St
- 77-17 Springfield Blvd Unit B
- 224-23 Kingsbury Ave Unit B
- 224-44 Kingsbury Ave Unit 2
- 22439 Kingsbury Ave Unit A
- 224-33 Kingsbury Ave Unit B
- 80-18 Springfield Blvd
- 224-24 Union Turnpike Unit 2N
- 224-24 Union Turnpike Unit 2B
- 224-65 Kingsbury Ave Unit B
- 78-27 226th St Unit B
- 226-01 Union Turnpike Unit A
- 80-35 Springfield Blvd Unit 6F
- 22424 Union Turnpike Unit 1H
- 226-09 Union Turnpike Unit B
- 226-26 Union Turnpike Unit 3-O
- 226-26 Union Turnpike Unit 1E
- 7809 223rd St
- 7809 223rd St
- 7815 223rd St
- 7805 223rd St
- 22314 Kingsbury Ave
- 7819 223rd St
- 7808 Springfield Blvd
- 7812 Springfield Blvd
- 78-08 Springfield Blvd
- 78-08 223
- 78-08 223rd St
- 7823 223rd St
- 7812 223rd St
- 7816 223rd St
- 7808 223rd St
- 7816 Springfield Blvd
- 7820 223rd St
- 22311 Kingsbury Ave
- 80-35 Springfield Blvd Unit 1H
- 80-35 Springfield Blvd Unit 5-H