Estimated Value: $269,052 - $298,000
--
Bed
2
Baths
1,654
Sq Ft
$173/Sq Ft
Est. Value
About This Home
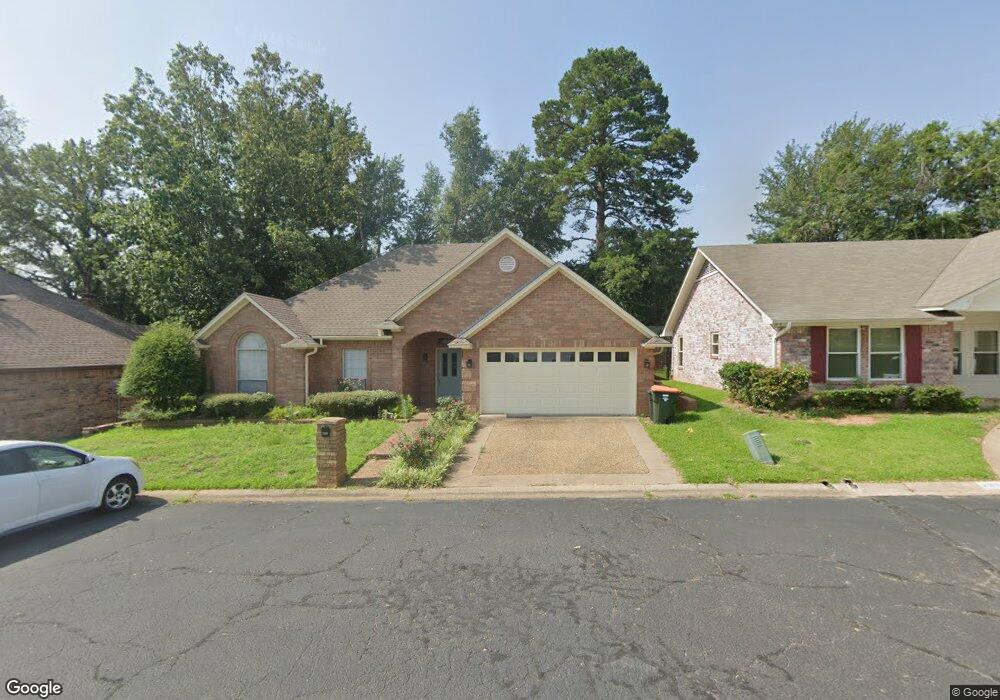
This home is located at 7809 Abbey Ct, Tyler, TX 75703 and is currently estimated at $285,763, approximately $172 per square foot. 7809 Abbey Ct is a home located in Smith County with nearby schools including Rice Elementary School, Hubbard Middle School, and Tyler Legacy High School.
Ownership History
Date
Name
Owned For
Owner Type
Purchase Details
Closed on
Nov 23, 2020
Sold by
Meyers Tiffanie C and Meyers Larry
Bought by
Nolivos Jaime and Nolivos Rosa E
Current Estimated Value
Home Financials for this Owner
Home Financials are based on the most recent Mortgage that was taken out on this home.
Original Mortgage
$10,604
Outstanding Balance
$9,399
Interest Rate
2.71%
Mortgage Type
New Conventional
Estimated Equity
$276,364
Purchase Details
Closed on
Mar 26, 2018
Sold by
Brooks Matthew
Bought by
Brooks Tiffanie C
Purchase Details
Closed on
Jul 31, 2017
Sold by
Wells Elaine Loretta
Bought by
Brooks Tiffanie C
Home Financials for this Owner
Home Financials are based on the most recent Mortgage that was taken out on this home.
Original Mortgage
$135,900
Interest Rate
3.9%
Mortgage Type
New Conventional
Purchase Details
Closed on
May 3, 2013
Sold by
Wells Kimberly D
Bought by
Wells Theadis William
Home Financials for this Owner
Home Financials are based on the most recent Mortgage that was taken out on this home.
Original Mortgage
$124,325
Interest Rate
3.61%
Mortgage Type
Purchase Money Mortgage
Create a Home Valuation Report for This Property
The Home Valuation Report is an in-depth analysis detailing your home's value as well as a comparison with similar homes in the area
Home Values in the Area
Average Home Value in this Area
Purchase History
| Date | Buyer | Sale Price | Title Company |
|---|---|---|---|
| Nolivos Jaime | -- | Landmark Title | |
| Brooks Tiffanie C | -- | None Available | |
| Brooks Tiffanie C | -- | None Available | |
| Wells Theadis William | -- | None Available |
Source: Public Records
Mortgage History
| Date | Status | Borrower | Loan Amount |
|---|---|---|---|
| Open | Nolivos Jaime | $10,604 | |
| Open | Nolivos Jaime | $212,087 | |
| Previous Owner | Brooks Tiffanie C | $135,900 | |
| Previous Owner | Wells Theadis William | $124,325 |
Source: Public Records
Tax History Compared to Growth
Tax History
| Year | Tax Paid | Tax Assessment Tax Assessment Total Assessment is a certain percentage of the fair market value that is determined by local assessors to be the total taxable value of land and additions on the property. | Land | Improvement |
|---|---|---|---|---|
| 2025 | $2,614 | $230,797 | $23,394 | $207,403 |
| 2024 | $2,614 | $253,723 | $29,955 | $223,768 |
| 2023 | $4,168 | $239,087 | $29,955 | $209,132 |
| 2022 | $4,325 | $220,736 | $19,970 | $200,766 |
| 2021 | $4,313 | $205,587 | $19,970 | $185,617 |
| 2020 | $3,325 | $155,372 | $19,970 | $135,402 |
| 2019 | $3,259 | $149,041 | $19,970 | $129,071 |
| 2018 | $3,000 | $137,917 | $19,970 | $117,947 |
| 2017 | $2,878 | $134,825 | $19,970 | $114,855 |
| 2016 | $2,726 | $127,692 | $19,970 | $107,722 |
| 2015 | $1,644 | $123,222 | $19,970 | $103,252 |
| 2014 | $1,644 | $123,066 | $19,970 | $103,096 |
Source: Public Records
Map
Nearby Homes
- 308 Canterbury Ct
- 8310 Columbia Dr
- 7889 Greenhill Dr
- 419 Wilder Way
- 8412 Crooked Trail
- 7614 Abbeywood Ct
- 8416 Crooked Trail
- 411 W Heritage Dr
- The Beckham Plan at Cumberland Place West
- The Tanglewood Plan at Cumberland Place West
- The Augusta Plan at Cumberland Place West
- The Donnybrook Plan at Cumberland Place West
- The Charnwood Plan at Cumberland Place West
- The Belmont Plan at Cumberland Place West
- The Tanglewood Plus Plan at Cumberland Place West
- The Elgem Plan at Cumberland Place West
- The Glenwood Plan at Cumberland Place West
- The Drexel Plan at Cumberland Place West
- The Elgem Plus Plan at Cumberland Place West
- The Cumberland Plan at Cumberland Place West
- 7809 7809 Abbey Ct
- 7807 7807 Abbey Ct
- 7807 Abbey Ct
- 201 Lansdowne Terrace
- 7805 Abbey Ct
- 7805 7805 Abbey Ct
- 200 Lansdowne Terrace
- 202 Lansdowne Terrace
- 7903 Camden Passage
- 7903 Camden Passage Ln
- 7803 7803 Abbey Ct
- 7803 Abbey Ct
- 7905 Camden Passage
- 204 Lansdowne Terrace
- 7802 7802 Abbey Ct
- 7802 Abbey Ct
- 205 205 First Crossing
- 205 1st Crossing
- 7907 Camden Passage
- 7801 Abbey Ct