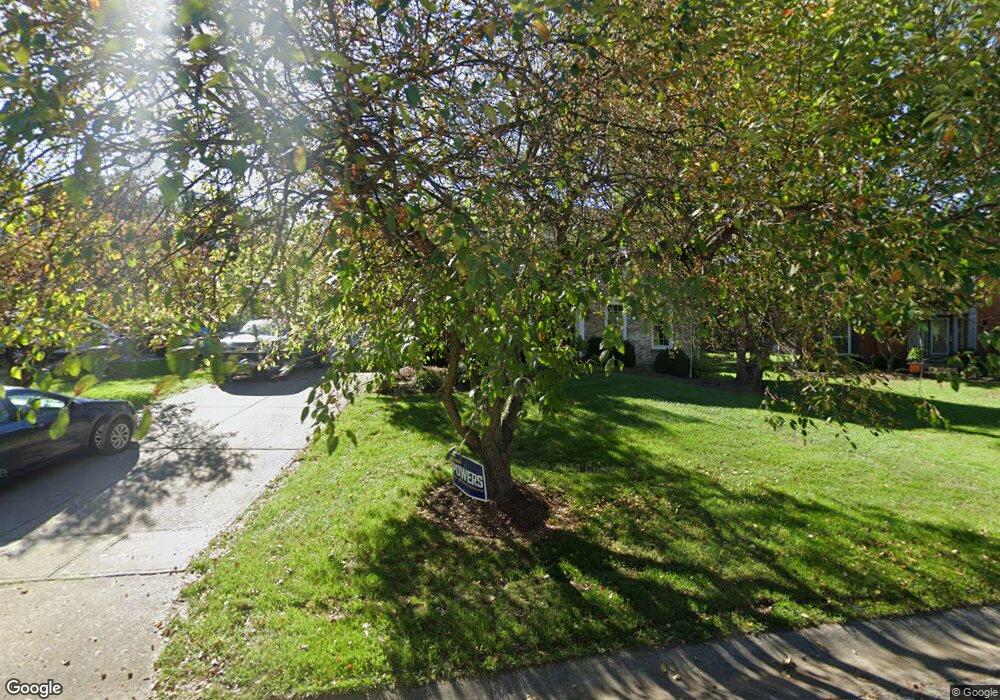
7809 Cloveridge Ct Cincinnati, OH 45244
Dry Run NeighborhoodEstimated Value: $558,564 - $628,000
4
Beds
4
Baths
2,696
Sq Ft
$220/Sq Ft
Est. Value
About This Home
This home is located at 7809 Cloveridge Ct, Cincinnati, OH 45244 and is currently estimated at $593,141, approximately $220 per square foot. 7809 Cloveridge Ct is a home located in Hamilton County with nearby schools including Wilson Elementary School, Nagel Middle School, and Turpin High School.
Ownership History
Date
Name
Owned For
Owner Type
Purchase Details
Closed on
Sep 25, 2002
Sold by
Gleis Mcmillin D Crystal and Gleis Leon
Bought by
Vancuren James and Vancuren Sandra
Current Estimated Value
Home Financials for this Owner
Home Financials are based on the most recent Mortgage that was taken out on this home.
Original Mortgage
$187,900
Outstanding Balance
$77,117
Interest Rate
6.13%
Estimated Equity
$516,024
Create a Home Valuation Report for This Property
The Home Valuation Report is an in-depth analysis detailing your home's value as well as a comparison with similar homes in the area
Home Values in the Area
Average Home Value in this Area
Purchase History
| Date | Buyer | Sale Price | Title Company |
|---|---|---|---|
| Vancuren James | $234,900 | Regional Title Inc |
Source: Public Records
Mortgage History
| Date | Status | Borrower | Loan Amount |
|---|---|---|---|
| Open | Vancuren James | $187,900 |
Source: Public Records
Tax History
| Year | Tax Paid | Tax Assessment Tax Assessment Total Assessment is a certain percentage of the fair market value that is determined by local assessors to be the total taxable value of land and additions on the property. | Land | Improvement |
|---|---|---|---|---|
| 2025 | $9,773 | $156,373 | $24,570 | $131,803 |
| 2024 | $9,497 | $156,373 | $24,570 | $131,803 |
| 2023 | $9,034 | $156,373 | $24,570 | $131,803 |
| 2022 | $8,069 | $124,373 | $24,126 | $100,247 |
| 2021 | $7,878 | $124,373 | $24,126 | $100,247 |
| 2020 | $7,969 | $124,373 | $24,126 | $100,247 |
| 2019 | $7,767 | $110,065 | $21,350 | $88,715 |
| 2018 | $7,275 | $110,065 | $21,350 | $88,715 |
| 2017 | $6,861 | $110,065 | $21,350 | $88,715 |
| 2016 | $6,945 | $108,843 | $21,756 | $87,087 |
| 2015 | $6,745 | $108,843 | $21,756 | $87,087 |
| 2014 | $6,750 | $108,843 | $21,756 | $87,087 |
| 2013 | $4,877 | $83,108 | $19,600 | $63,508 |
Source: Public Records
Map
Nearby Homes
- 1858 Foxhollow Dr
- 2274 Pointe Place
- 7712 Stonehill Dr
- 2105 Clough Chase Dr
- 2106 Forestlake Dr
- 2121 Clough Chase Dr
- 1786 Woodpine Ln
- 7660 Clough Pike
- 7652 Clough Pike
- 8146 Clough Pike
- 8069 Ashgrove Dr
- 7967 Kimbee Dr
- 7968 State Rd
- 7392 Hunley Rd
- 1750 Emerald Glade Ln
- 7481 Heatherwood Ln
- 2559 Concordgreen Dr
- 1847 Eight Mile Rd
- 8022 Stonegate Dr
- 1363 Oak Ct
- 7815 Cloveridge Ct
- 7803 Cloveridge Ct
- 7800 Cloveridge Ct
- 7821 Cloveridge Ct
- 7802 Outlookridge Ln
- 7816 Cloveridge Ct
- 7808 Cloveridge Ct
- 7766 Meadowcreek Dr
- 7774 Meadowcreek Dr
- 7804 Cloveridge Ct
- 7760 Meadowcreek Dr
- 7808 Outlookridge Ln
- 7822 Cloveridge Ct
- 7827 Cloveridge Ct
- 7780 Meadowcreek Dr
- 2120 Bruns Ln
- 2110 Bruns Ln
- 2130 Bruns Ln
- 7803 Outlookridge Ln
- 7828 Cloveridge Ct
Your Personal Tour Guide
Ask me questions while you tour the home.