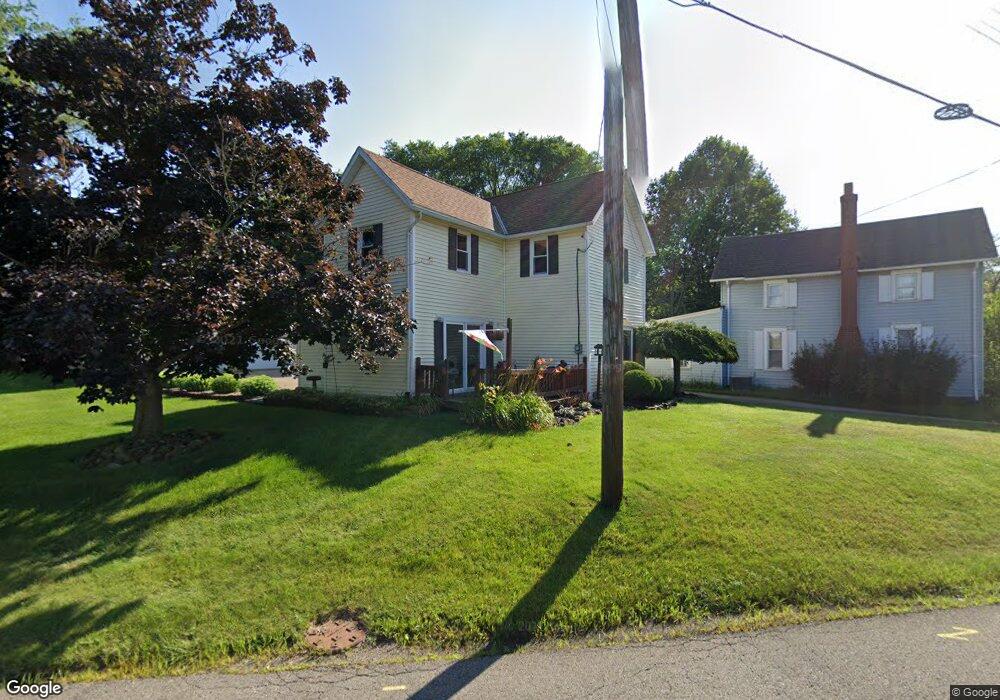
781 Hickory Ln Mansfield, OH 44905
Estimated Value: $138,000 - $165,000
3
Beds
1
Bath
1,310
Sq Ft
$115/Sq Ft
Est. Value
About This Home
This home is located at 781 Hickory Ln, Mansfield, OH 44905 and is currently estimated at $150,072, approximately $114 per square foot. 781 Hickory Ln is a home located in Richland County with nearby schools including Madison High School, St. Peter's Elementary/Montessori School, and Temple-Christian School.
Ownership History
Date
Name
Owned For
Owner Type
Purchase Details
Closed on
Jun 12, 1997
Sold by
Welch Rose M
Bought by
Steele James L and Stout Jacquelyn
Current Estimated Value
Home Financials for this Owner
Home Financials are based on the most recent Mortgage that was taken out on this home.
Original Mortgage
$47,500
Outstanding Balance
$6,885
Interest Rate
8.13%
Mortgage Type
New Conventional
Estimated Equity
$143,187
Purchase Details
Closed on
May 3, 1993
Sold by
Groscost Timothy E
Bought by
Groscost Tevin L
Purchase Details
Closed on
Dec 1, 1985
Create a Home Valuation Report for This Property
The Home Valuation Report is an in-depth analysis detailing your home's value as well as a comparison with similar homes in the area
Home Values in the Area
Average Home Value in this Area
Purchase History
| Date | Buyer | Sale Price | Title Company |
|---|---|---|---|
| Steele James L | $50,000 | -- | |
| Groscost Tevin L | $39,000 | -- | |
| -- | $9,000 | -- |
Source: Public Records
Mortgage History
| Date | Status | Borrower | Loan Amount |
|---|---|---|---|
| Open | Steele James L | $47,500 |
Source: Public Records
Tax History
| Year | Tax Paid | Tax Assessment Tax Assessment Total Assessment is a certain percentage of the fair market value that is determined by local assessors to be the total taxable value of land and additions on the property. | Land | Improvement |
|---|---|---|---|---|
| 2024 | $1,569 | $33,090 | $6,610 | $26,480 |
| 2023 | $1,605 | $33,090 | $6,610 | $26,480 |
| 2022 | $1,450 | $26,570 | $6,220 | $20,350 |
| 2021 | $1,450 | $26,570 | $6,220 | $20,350 |
| 2020 | $1,461 | $26,570 | $6,220 | $20,350 |
| 2019 | $1,412 | $22,820 | $5,270 | $17,550 |
| 2018 | $1,320 | $22,820 | $5,270 | $17,550 |
| 2017 | $1,292 | $22,820 | $5,270 | $17,550 |
| 2016 | $1,256 | $21,440 | $5,010 | $16,430 |
| 2015 | $1,198 | $21,440 | $5,010 | $16,430 |
| 2014 | $2,088 | $21,440 | $5,010 | $16,430 |
| 2012 | $1,042 | $22,560 | $5,270 | $17,290 |
Source: Public Records
Map
Nearby Homes
- 62 Bahl Ave
- 822 Park Ave E
- 832 Park Ave E
- 0 North St Unit 9072753
- 410 Birdcage Walk
- 90 Oak St
- 57 S Walker Ave
- 625 Mansfield Lucas Rd
- 260 Dale Ave
- 59 Ridge Rd S
- 519 S Diamond St
- 291 Stewart Rd N
- 382 Orange St
- 203 Home Ave
- 195 Hedges St
- 223 Hedges St
- 146 E 1st St
- 1303 Park Ave E
- 167 S Adams St
- 794 Mansfield Washington Rd
Your Personal Tour Guide
Ask me questions while you tour the home.